 Database Tutorials MSSQL, Oracle, PostgreSQL, MySQL, MariaDB, DB2, Sybase, Teradata, Big Data, NOSQL, MongoDB, Couchbase, Cassandra, Windows, Linux
Parameter Sniffing is the result of using the query plan in the cache.
When a stored procedure is compiled the last time a query plan is created according to the incoming parameter, this query plan may not be suitable for the next parameter.
In this case, the stored procedure may work with an inappropriate query plan and take much longer than expected.
This can occur when running sp_executesql command with the parameter or in other technologies that generate parametric code such as linq.
Sometimes you can observe sudden CPU increases in your systems.
The average usage of the CPU may start to fluctuate from 20% to 100%.
In this case, you may think that they are using the system intensively or they are taking a report.
Of course, you may be experiencing parameter siniffing as well.
The biggest indicator of the problem is parameter sniffing is to see that the longest running queries that are currently running on the system are from the same queries.
You may use the tsql code in my article “How To See Current Queries On SQL Server”
But the following way can be followed to make sure of this.
When you run the tsql code in the above article, we take a text value in a row that is returned in the result set and transfer it to a new session.
You should specify a specific field in the query you are sending to the new query screen and write it in the following script.
For example, in the “Select Extent1.MaximumAge FROM tablea Extent1” query, we can add “Extent1.MaximumAge” to the section after the text like statement in the below script.
1 2 3 4 5 6 | SELECT [text], cp.size_in_bytes, plan_handle FROM sys.dm_exec_cached_plans AS cp CROSS APPLY sys.dm_exec_sql_text(plan_handle) WHERE cp.cacheobjtype = N'Compiled Plan' and text like '%Extent1.MaximumAge%' ORDER BY cp.size_in_bytes DESC; |
When we run the above query, we find the question causing the problem and note the value of plan_handle one time.
To reset the query plan value of the problematic query in the cache, we add this plan_handle value to the relevant part of the following query.
1 | DBCC FREEPROCCACHE (value in plan_handle column); |
In this way we allow the query to create a query plan again.
If the CPU usage on the system returns to normal after a while, we can say that we are experiencing parameter sniffing.
How can we prevent the parameter sniffing?
There is more than one solution for this problem.
First of all, if you know the distribution of the data and how the incoming parameters predominantly come from, you can apply the solution as follows.
Solution1:
For example, if the stored procedure gets x value 99% as a parameter and compiled according to y when it was compiled last time, every time we call the stored procedure with x, we will run the wrong query plan and parameter sniffing will occur.
In such a case, we can solve this problem with adding a hint to the SP as follows.
when we add this hint on sp, the query plan will occur based on the x value.
Of course this solution can be used in very specific situations.
1 2 3 | SELECT * FROM TableXXX WHERE Kolon_A=@Param OPTION(OPTIMIZE FOR (@Param=x)) |
Solution2:
We can add the following hint to recompile the SP every time.
But in this solution, sp will be recompiled every time, so it will bring an unnecessary workload to the CPU.
1 2 3 | SELECT * ROM TableXXX WHERE Kolon_A=@Param OPTION(RECOMPILE) |
Solution3:
This solution is the solution I use on my own systems.
At the end of the SP we add an expression for the variable that causes parameter sniffing as follows.
You can provide the same query plan usage for each incoming value for this parameter.
you can add “OPTION (OPTIMIZEFOR (@ parameter = UNKNOWN))” to create the same query plan for one parameter that can cause parameter sniffing in the query.
Or you can add “OPTION (OPTIMIZEFOR UNKNOWN)” to create the same query plan for all values that can cause parameter sniffing in the query.
Lets clarify this issue with a detailed example.
Open a new session and create a stored procedure using the following script.
1 2 3 4 | CREATE PROCEDURE PS (@param int) AS SELECT * FROM Sales.SalesOrderDetail WHERE ProductID = @param |
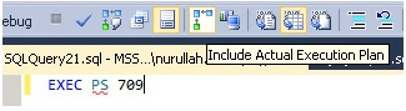
Before running this SP that we have created, let’s click on the include actual execution plan as shown in the figure below. In this way the query will give us the execution plan after it have finished.
When we run the query, we get the following result.
As you see, Actual number of rows and Estimated number of rows are the same.
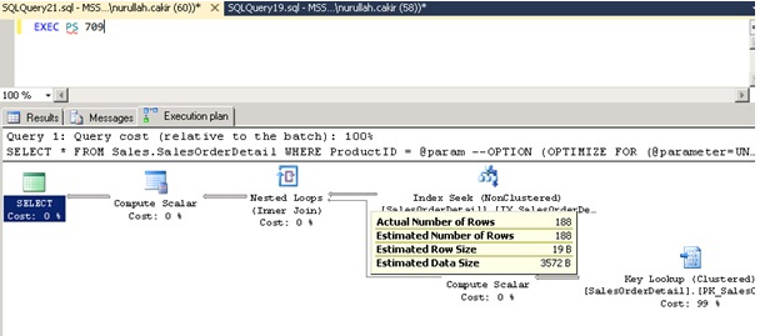
Under normal circumstances, the best “query plan” occurs using the histogram.
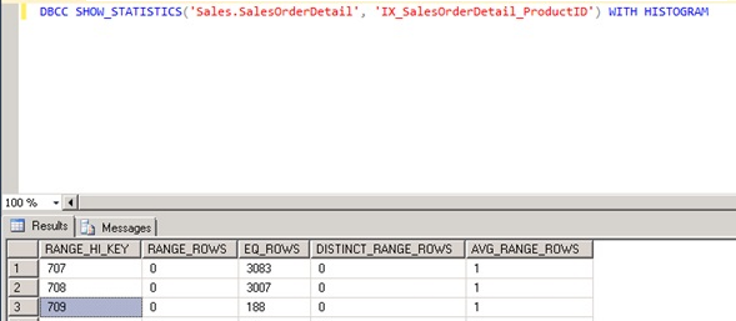
Now let’s examine the histogram of the Index.
When we run the following query, we see 188 in the EQ_EOWS column for the record with RANGE_HI_KEY 709.
1 | DBCC SHOW_STATISTICS('Sales.SalesOrderDetail', 'IX_SalesOrderDetail_ProductID') WITH HISTOGRAM |
But as we mentioned at the beginning of the topic, we may sometimes encounter parameter sniffing.
The first “query plan” produced according to a certain parameter using histogram is the best “query plan”, but it can be very bad compared to some later parameters.
To prevent this, change the SP as follows.
When we change the SP as follows, the query plan is created by looking at the density vector rather than looking at the histograms at the time of creation.
And regardless of what parameter the query comes from, it uses the same query plan every time.
1 2 3 4 5 6 7 | USE [AdventureWorks] GO ALTER PROCEDURE [dbo].[PS] (@param int) AS SELECT * FROM Sales.SalesOrderDetail WHERE ProductID = @param OPTION (OPTIMIZE FOR (@param UNKNOWN)) |
And let’s run the SP again.
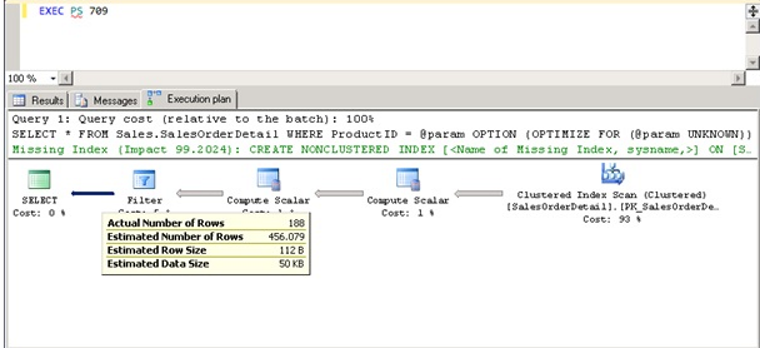
As shown in the above example, the actual number of rows is 188, the estimated number of rows is calculated as 456.
I can say that the query plan generated using the density vector is less healthy than the query plan generated using histograms, but blocks parameter sniffing in many scenarios.
In the above example, it looks like it produced a bad value for the 709 ProductID according to the histogram.
However, when working with 708 or 707 ProductId, it will work with a better query plan than the query plan generated by working with parameter 709 and using histograms.
Factors such as the distribution of the data, how often the parameter arrives, and the size of the object determine whether this property is useful.
You should absolutely test this feature before applying it in the production environment.
You can do the test by creating a virtual workload.
![]()