 Database Tutorials MSSQL, Oracle, PostgreSQL, MySQL, MariaDB, DB2, Sybase, Teradata, Big Data, NOSQL, MongoDB, Couchbase, Cassandra, Windows, Linux
In my previous articles; We installed Elasticsearch on the Ubuntu server(10.250.2.221) and logstash on the ubuntu server(10.250.2.222), and then we sent dummy data from logstash to elasticsearch and saw that this data was indexed in elasticsearch.
In this article, we will install kibana on ubuntu server 2019.10(10.250.2.223), which represents the letter K of the ELK stack, and integrate kibana with elasticsearh and visualize dummy data indexed in elasticsearch, and we will see how our data are visualized with Kibana through web browser.
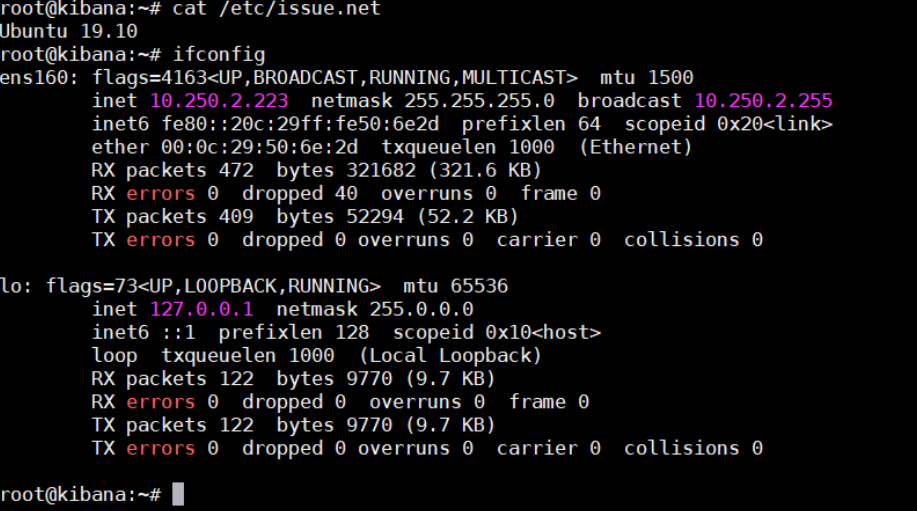
Kibana installation will be shorter than elasticsearch and logstash because kibana does not expect us to install java jdk packages. As always, let’s start our setup by checking the version and ip address of our server.
1 2 | root@kibana:~# cat /etc/issue.net root@kibana:~# ifconfig |
Let’s add the Elasticsearch GPG key and repo.
1 2 | root@kibana:~# wget -qO – https://artifacts.elastic.co/GPG-KEY-elasticsearch | sudo apt-key add – root@kibana:~# echo “deb https://artifacts.elastic.co/packages/6.x/apt stable main” | sudo tee -a /etc/apt/sources.list.d/elastic-6.x.list |

Install Kibana on Ubuntu
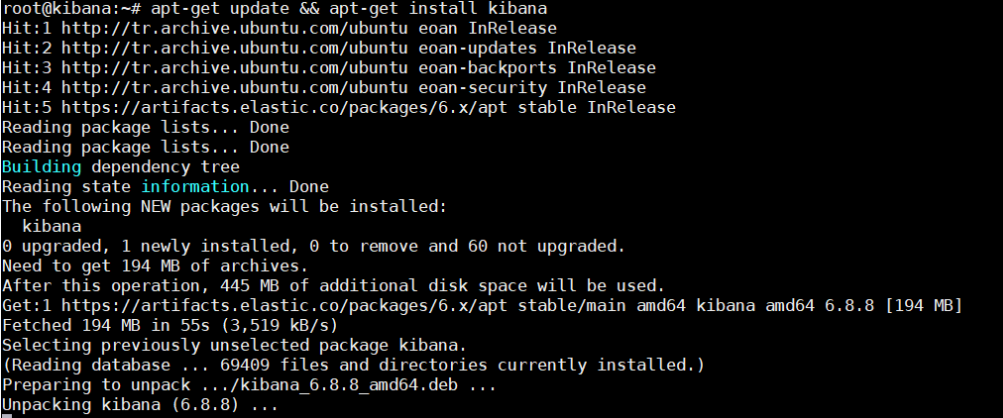
We can now install kibana.
1 | root@kibana:~# apt-get update && apt-get install kibana |
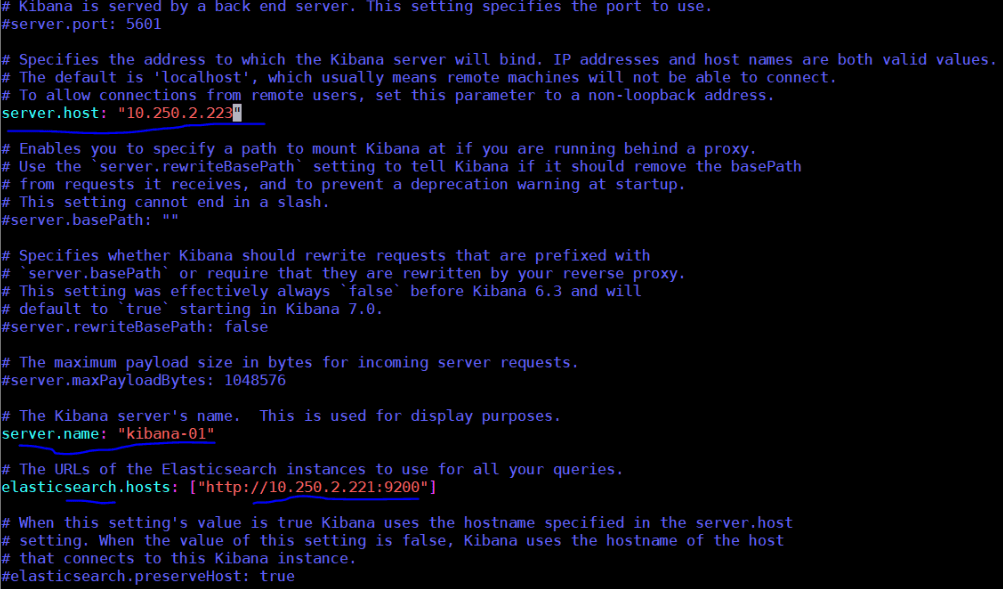
Before starting the Kibana service, let’s write the ip address of the network interface where kibana will run and the ip address of elasticsearch(10.250.2.221) that kibana will integrate in /etc/kibana/kibana.yml configuration file.
Start Kibana Service
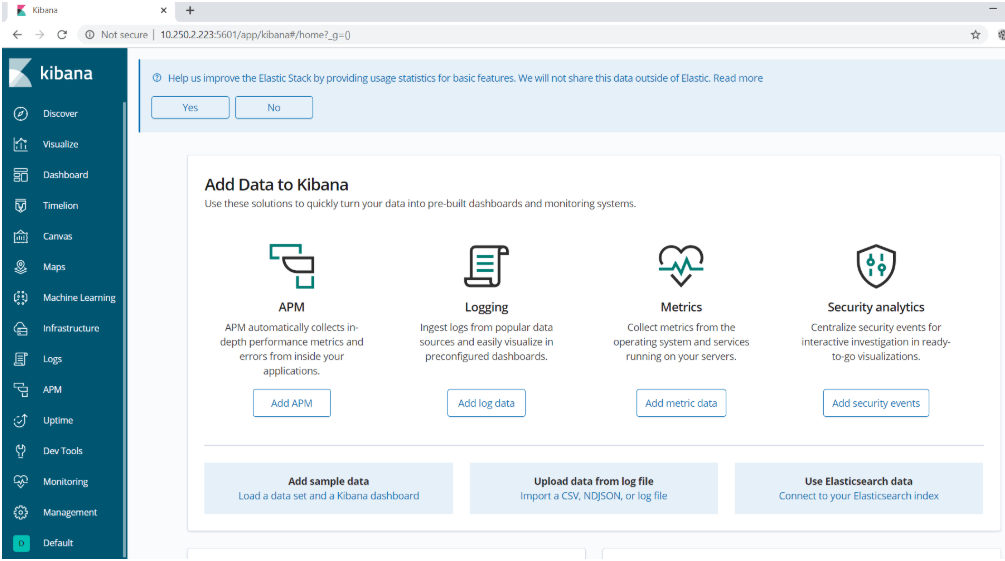
We can now start the Kibana service. Kibana will work on port 5601 by default. When we go to the address http://10.250.2.223:5601 on the browser after the service starts, we will see the kibana page.
1 2 | root@kibana:~# service kibana start root@kibana:~# systemctl enable kibana.service |
Create Index Pattern on Kibana
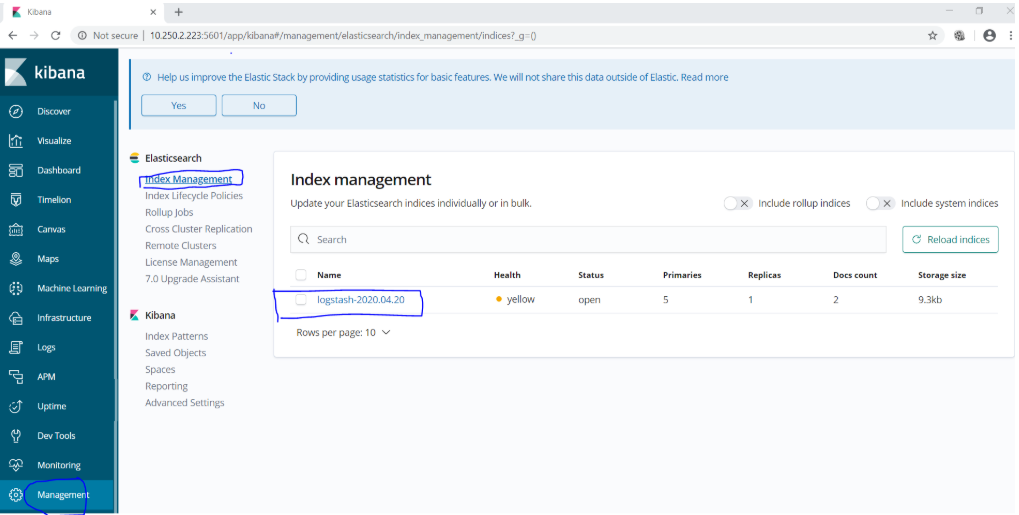
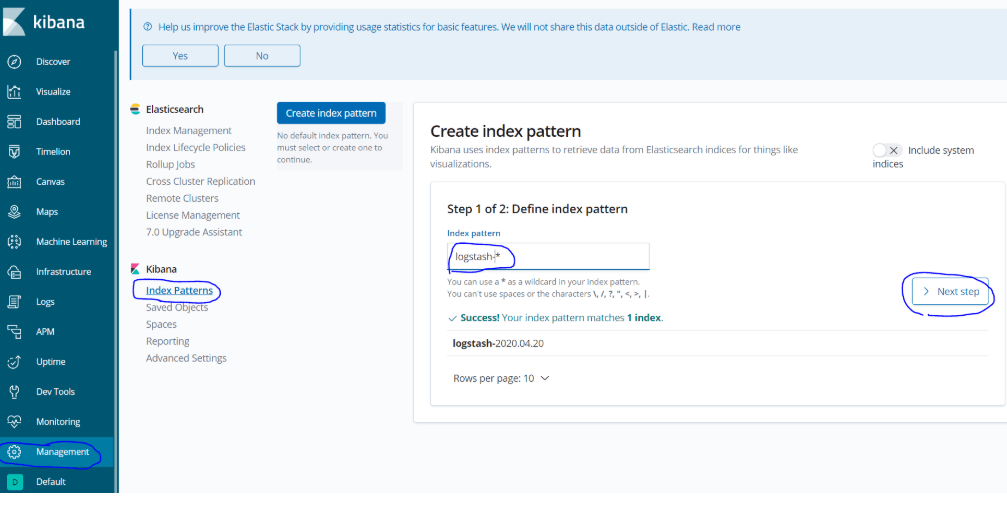
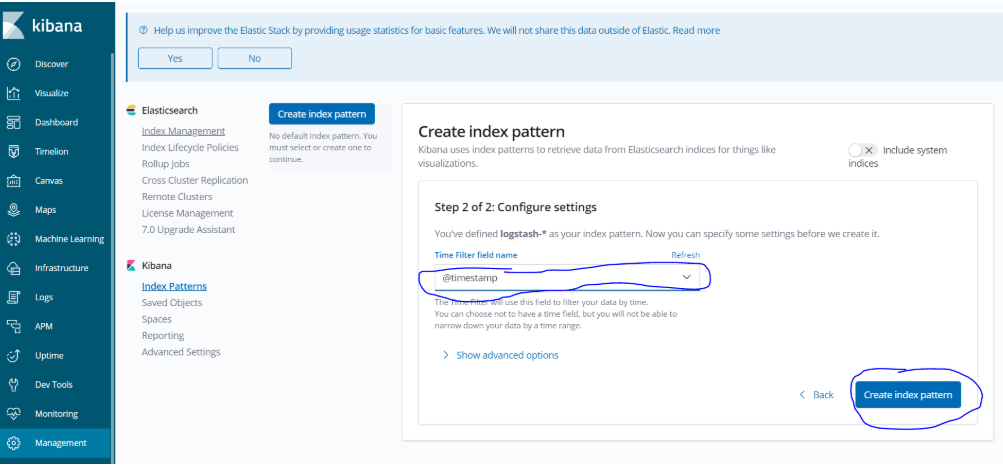
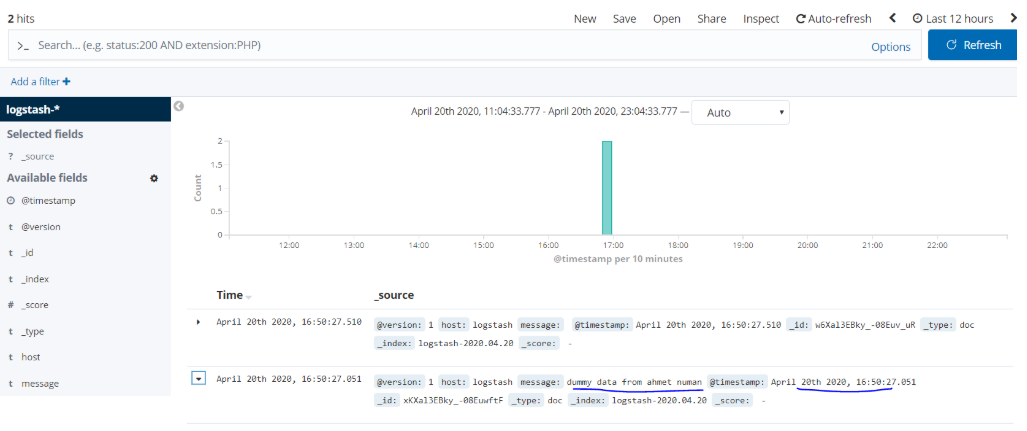
Now, let’s add the index of dummy data that we sent to elasticsearch earlier to the index pattern and confirm that this data is seen in the Discover section. For this, in order;
- Managment> Elasticsearch> Index Managment (here we will see indexes on elastic)
- Managment> Kibana> Index Pattern (We will add the index we see on Elastic as an index pattern from here)
Now we can see the dumy data we created earlier on the Kibana screen. For this, it is enough to come to the discover tab.
With this article, we have successfully completed the installations of Elasticsearch, Logstash and Kibana, our magnificent trio in the ELK stack.
To remind the process again; We will transfer the logs from the sources we want to collect to Logstash with beats, the data coming on Logstash will be filtered and made more structered and sent to elasticsearch as output, and the data indexed on eleasticsearch will be visualized with Kibana.
Now we will start the beat installation and collect logs from systems in real sense. In the next article, we will transfer the eventlogs on windows server 2019 with 10.250.2.224 ip address to logstash with winlogbeat, send them to elasticsearch via logstash and visualize these logs in kibana.
See you in the next article…..
You can read our other articles in this serie from the links below.
Install Elasticsearch on ubuntu server 19.10
Install Logstash on Ubuntu Server 19.10
Install Kibana on Ubuntu Server 19.10
Install Winlogbeat on Windows Server 2019
Configure Logstash to Read log files Windows
Create Kibana Dashboards For Windows Event Logs
![]()