 Database Tutorials MSSQL, Oracle, PostgreSQL, MySQL, MariaDB, DB2, Sybase, Teradata, Big Data, NOSQL, MongoDB, Couchbase, Cassandra, Windows, Linux
Hello Everyone,
This is my first blog here regarding db2 database monitoring.I am going to start from the basic level ,therefore starts and learners can easily understand.
I will try to make more interesting and I hope users will like to read more on db2 .
1.<What this unit is about >
This unit introduces the monitoring tools provided for DB2 databases. We will compare the newer monitoring infrastructure implemented in DB2 9.7 to the older snapshot monitoring. We will describe monitoring using db2pd commands and also show how to monitor using the monitoring SQL functions and views.
2.<What you should be able to do>
After completing this unit, you should be able to:–(Unit objectives)
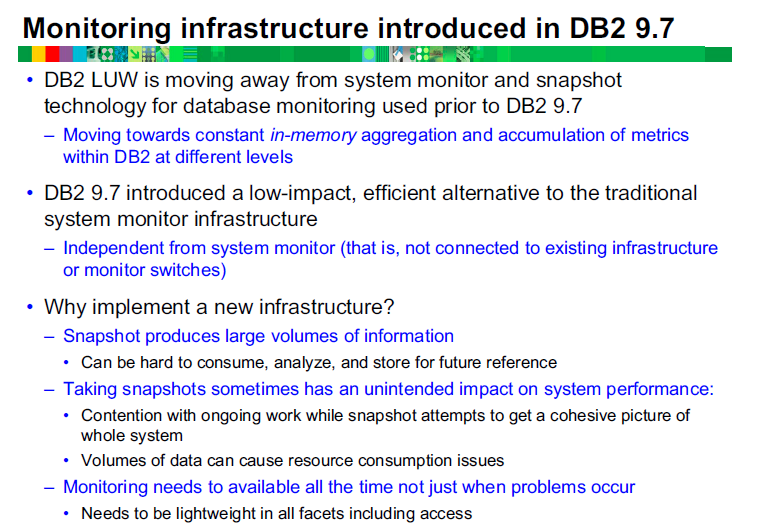
•Compare the infrastructure used to support SNAPSHOT monitoring with the monitoring infrastructure introduced in DB2 9.7
•Configure a database to collect the activity and object metrics returned by the Monitoring Table functions
•Use the db2pd to perform performance analysis or problem determination for a DB2 database
•Utilize the DB2 provided table functions and views with SQL in reporting and monitoring of the database system, data objects, and the package cache to help you quickly identify issues that might be causing problems
•Configure the DB2 Database configuration options that control the collection of request, activity and object level metrics on the entire database.
<Why should you monitor a DB2 database?>

•Forecast hardware requirements based on database usage patterns.
•Analyze the performance of individual applications or SQL queries.
•Track the usage of indexes and tables.
•Pinpoint the cause of poor system performance.
•Assess the impact of optimization activities, for example:
•Altering database manager configuration parameters
•Adding indexes
•Modifying SQL queries
Notes:
The term database monitoring refers to the tasks associated with examining the operational status of your database.
Database monitoring is a vital activity for the maintenance of the performance and health of your database management system.
To facilitate monitoring, DB2 collects information from the database manager, its databases, and any connected applications. With this information you can perform the following types of tasks, and more:
•Forecast hardware requirements based on database usage patterns.
•Analyze the performance of individual applications or SQL queries.
•Track the usage of indexes and tables.
•Pinpoint the cause of poor system performance.
•Assess the impact of optimization activities (for example, altering database manager configuration parameters, adding indexes, or modifying SQL queries).
3.<Interfaces for database monitoring >
There are two ways to monitor operations in your database. You can view information that shows the state of various aspects of the database at a specific point in time. Or, you can set up event monitors to capture historical information as specific types of database events take place.
4.<Monitor elements>
Monitor elements are data structures used to store information about a particular aspect of the database system status. For example, the monitor element direct_reads reflects the number of read operations that take place that are performed directly from disk, rather than from any buffer pool.
Notes:
DB2 9.7 introduced a new monitoring infrastructure that you can access through new table functions and new event monitors. This infrastructure is a superior alternative to the existing system monitor, event monitors, snapshot commands, and snapshot SQL interfaces.
The new monitoring infrastructure is independent from the snapshot based statistics used in prior releases and does not use the DB2 instance level switches to control detailed data collection.
The GET SNAPSHOT command reports returned large amounts of information which could take extra effort to locate the specific data needed. For example, the table snapshot lists every table accessed and the table space snapshot lists every defined table space.
Using the snapshot based SQL functions and views allowed the snapshot statistics to be selectively accessed, but the internal processing would still incur the overhead associated with producing a complete set of statistics.
The system overhead associated with some of the snapshot switches that control collection of detailed statistics lead some users to only turn on the detailed data when needed for a specific problem or tuning effort.
The new monitoring infrastructure was designed to provide detailed system and application statistics with a reduced overhead for collecting the monitor data. The plan is to provide a set of views and functions based on the new monitoring facility that will eventually completely replace snapshot based monitoring.
To be continued in the next unit …. 🙂
![]()