Sometimes when we get ERROR messages such as the communication failure, MySQL server not responds your requests, or we want to know what the client sent to MySQL and how MySQL responds? Then we can capture network packets of the client and MySQL server.
Preparing:
Capturer tool: tcpdump command on Linux
Packets Analyzer: Wireshark https://www.wireshark.org/
MySQL Version: 8.0.12
MySQL Port: 8001
1. Capture packets
(1) Start capturing packets
1 | tcpdump -nnei any port 8001 -w tmp.pcap |
Also you can get more information about tcpdump at https://www.tcpdump.org/manpages/tcpdump.1.html .
(2) Connect to MySQL Server and execute your queries
Open a new session for MySQL client.
1 2 3 4 5 6 7 8 9 10 11 12 13 14 15 16 17 18 19 20 21 22 23 24 25 26 27 28 29 30 31 32 33 34 35 36 37 38 39 40 41 42 43 44 45 46 47 48 49 50 51 52 53 54 55 56 57 58 59 60 61 62 63 64 65 66 67 | mysql -uroot -pqweasd -P 8001 -h192.168.100.184 mysql> show databases; +--------------------+ | Database | +--------------------+ | information_schema | | mysql | | performance_schema | | sbtest | | sys | | testarchive | | wstest | +--------------------+ mysql> use wstest mysql> show tables; +------------------+ | Tables_in_wstest | +------------------+ | mul_replace | | mul_replace_new | | t1 | | test | +------------------+ mysql> select * from t1; +-----+------+-------+ | a | b | c | +-----+------+-------+ | 1 | 2 | 3 | | 2 | 3 | 100 | | 3 | 4 | 100 | | 11 | 16 | 30000 | | 431 | 12 | 99 | +-----+------+-------+ mysql> exit |
(3) Stop capturing
Just enter Ctrl+c to stop capturing process. Then we can get a file named tmp.pcap.
2. Analyze packets
Send the tmp.pcap file to a Windows PC, and using Wireshark to open it(Click File–Open to choose the packet file). After that, Wireshark shows the packets information as below.
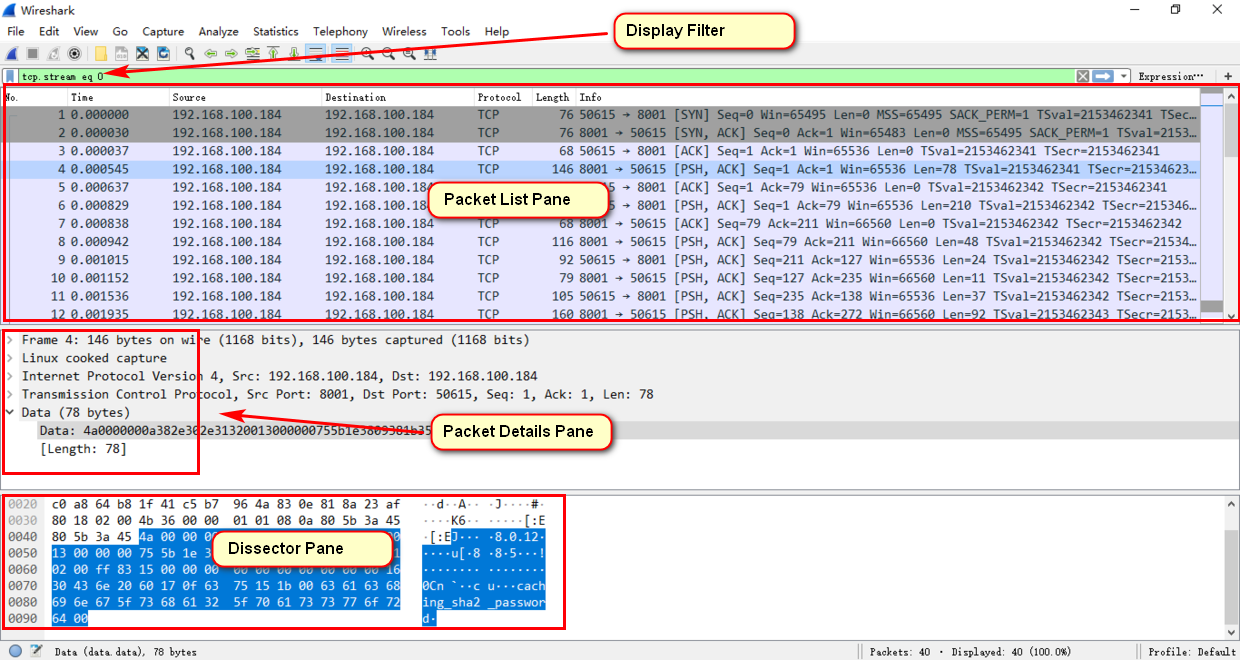
There are a lot of information, and we just check the Data part of the Packet Details Pane this time.
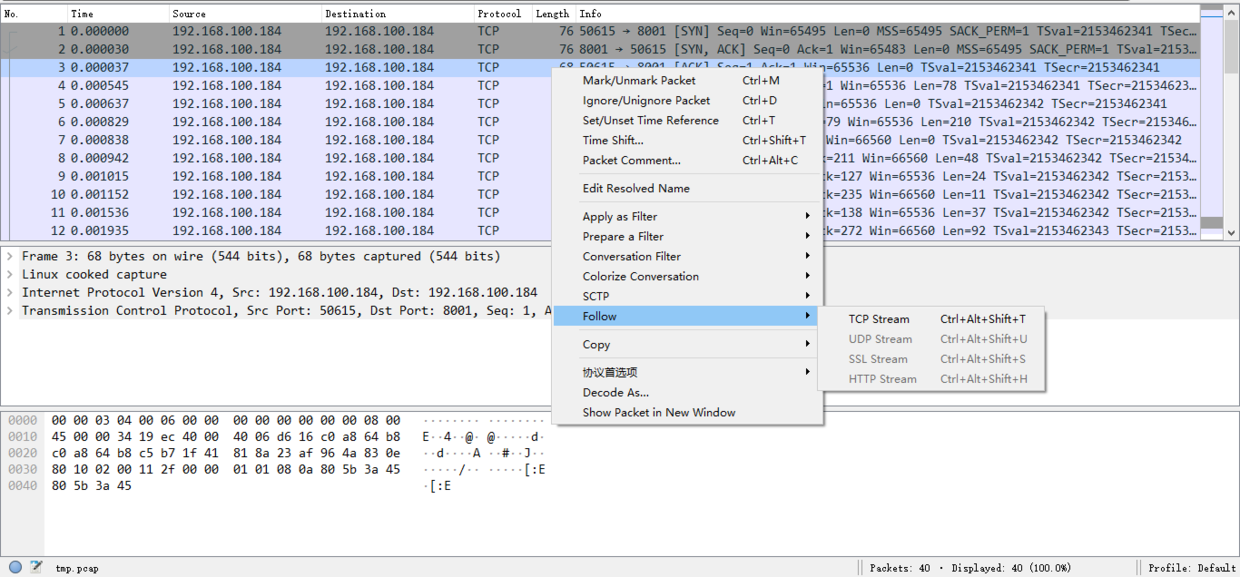
Then choose one of the TCP stream, ‘8001 -> 50615’ and ‘50615 -> 8001’ at the Info column mean the source and destination ports, right click —-> Follow —-> TCP Stream, after that, we can get the data details during the capturing time.
As the TCP Stream showing below, we can see what information has been transmitted on the network.
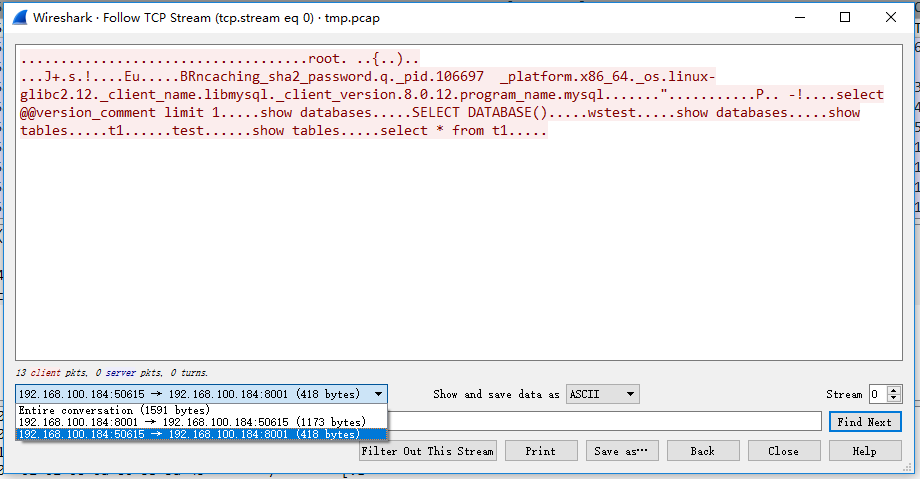
And we can choose ‘8001 —-> 50615(send from MySQL server)’ or ‘50615 —->8001(send to MySQL server)’, and if ‘choosing 50615 —-> 8001’, then we can get the information we just executed:
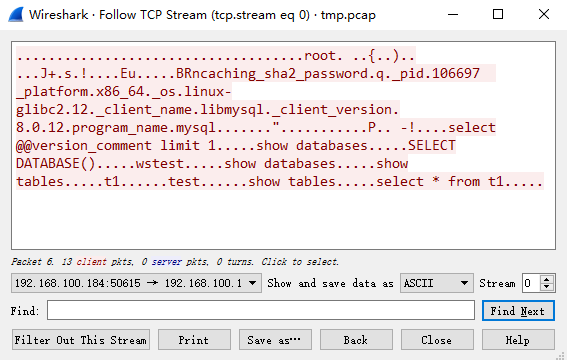
And we can see some key words like ‘caching_sha2_password‘(MySQL password encryption method), ‘mysql._client_version.8.0.12‘(MySQL Client version), ‘show databases‘, ‘show tables‘, ‘select * from t1‘.Also, we can get the information the server responds to these queries:
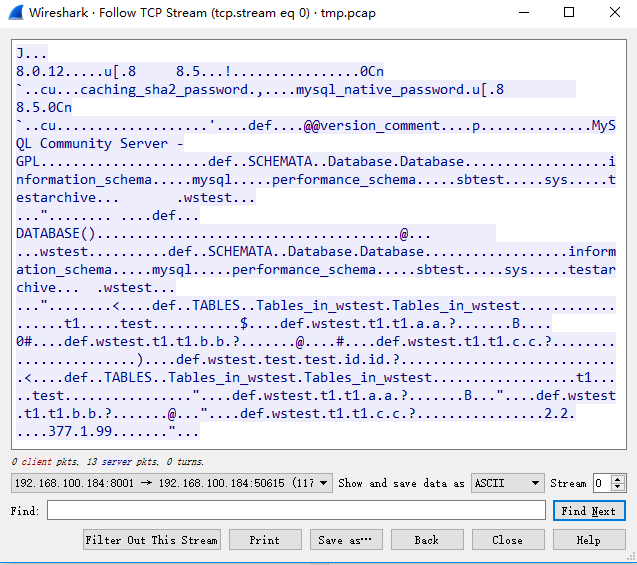
Then we can get the data that server sent to client, such as ‘8.0.12‘,’caching_sha2_password‘, ‘mysql_native_password‘, ‘MySQL Community Server – GPL‘,’information_schema, mysql, performance_schema,sys, wstest‘ and so on. And these information are just what we can get after we execute queries.
In our daily work, we can use this method to find out what information has been sent between the MySQL client and server. Also we can use it for auditing MySQL by analyzing packets, and this way won’t affect the performance of database instance because the audit log is obtained through capturing network packets.
![]()
 Database Tutorials MSSQL, Oracle, PostgreSQL, MySQL, MariaDB, DB2, Sybase, Teradata, Big Data, NOSQL, MongoDB, Couchbase, Cassandra, Windows, Linux