Oracle stores the following components in Memory.
- Program Code
- Connected sessions even if not active
- Information required during Query Execution. For example, if the query fetches which rows
- Information shared and communicated between Oracle processes. For example, lock information
- Data blocks and redo log records are kept in memory for caching purposes.
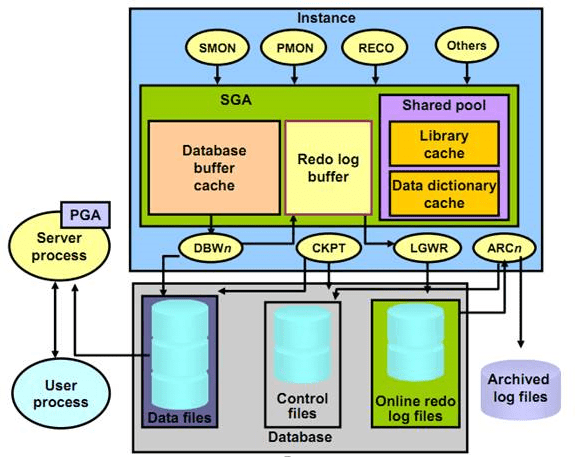
We can examine Memory in two main chapters. First you should look at the below screenshot to understand memory components.

SGA(System Global Area):
It is a memory area shared by all server and background processes.
It is also known as the “Shared Global Area”.
The SGA consists of the following components.
- Database buffer cache
- Redo log buffer
- Shared pool
- Java pool
- Large pool (optional)
- Streams pool
Automatic Shared Memory Management
All SGA components allocote and deallocate areas in units of granules.
In many SGAs smaller than 1 GB, the granule size is 4 MB. In large SGAs the granule size is 16 MB.
What is SGA_TARGET?
If you do not set the SGA_TARGET initialization parameter, you must set the above components one by one.
If you set the SGA_TARGET parameter, you do not need to set these components.
Oracle shares the SGA_TARGET value you set with these components.
This process is called Automatic Shared Memory Management.
What is SGA_MAX_SIZE?
There is a SGA_MAX_SIZE parameter. This parameter specifies the maximum memory that the SGA can reach.
When you change this parameter, you need to restart the instances used by the database.
You can increase SGA_TARGET to SGA_MAX_SIZE without performing any restart operation.
After setting SGA_TARGET, oracle analyze the system workload and distribute memory among the above sga components. If you set SGA_TARGET in the sp_file, memory distribution is automatically performed according to the last known memory distribution in case of instance restart. Thus, unnecessary workload on the system is not re-analyzed.
If you set SGA_TARGET, the keep buffer pool (to keep the data blocks of the specified schema in memory) and the recycle buffer pool (to remove unnecessary data blocks from memory) are not automatically set.
You can make the configurations using the parameters DB_KEEP_CACHE_SIZE and DB_RECYCLE_CACHE_SIZE.
Automatic Memory Management
If you set MEMORY_TARGET, the SGA and PGA are automatically set by oracle. This process is called Automatic Memory Management.
Manual Memory Management
If you manually set all components, this process is called Manual Memory Management.
With the V$BUFFER_POOL view you can check the size of the cache.
With the V$SGASTAT view, you can get information about SGA components.
SGA Components
Let’s examine the SGA components one by one.
Database Buffer Cache
It is a part of the SGA that stores the data blocks read from the data files.
First, let’s examine the following two concepts for database buffer cache.
Write List
The Write List contains data that has changed since it was received in memory but has not been written to the disk.
LRU(Least Recently Used) List
Free buffers, pinned buffers, and dirty buffers that have not been transferred to the write list are kept in the LRU List.
Free Buffer is a ready-to-use buffer.
A pinned buffer is a buffer that is accessed by some processes at that time.
What is the role of the database buffer cache?
When an Oracle process needs a dataset, it first looks in the database buffer cache.
If it does not find it here, than it fetches the data from the disk to the buffer cache and reads it from database buffer cache.
When data is transferred to the database buffer cache, it is first checked whether there is a free buffer in memory.
When searching for a free buffer, if there is a dirty buffer in the LRU List, this dirty buffer will be transferred to the Write List.
There is a limit to the search data in the buffer cache.
If the free buffer is not found until this limit is reached, the search is terminated and the DBWn background process is signaled to write the dirty pages to the disk.
When free buffer is found, the data is transferred to MRU(Most Recently Used) at the end of the LRU List.
In Full Table Scan, the data is passed to the PGA by bypassing the SGA.
In some cases, if you want data that causes a full table scan to be transferred to the database buffer cache, you can provide it with the following script.
But when you run this script, getting large table scans into the database buffer cache can cause other queries to not be found in the cache and cause performance problems.
1 | ALTER TABLE ... CACHE |
If you want to keep the table in keep pool in memory, you can use the following script.
1 | ALTER TABLE ... STORAGE BUFFER_POOL KEEP |
If you want to keep the database in the buffer cache completely, you can use the following script.
But your buffer cache size must be larger than your database size.
1 | ALTER DATABASE ... FORCE FULL DATABASE CACHING |
Redo Log Buffer
This is the memory area which the queries are stored in the memory before being written to the redo log.
For redo log buffers, usually small values are set.
It is almost real-time to write the redo logs from the redo log buffer.
When a commit operation is performed, the data in the redo log buffer is written to the redo log in real time.
If the space in the redo log buffer is large, the amount of space required to write to the disk will increase when commit is performed.
Therefore, setting the redo log buffer to large can cause performance problems.
The LGWR(Log Writer Background Process) process writes the data in the Redo Log Buffer to the redo log.
If the speed of the LGWR does not reach the density of the records written to the redo log buffer, the solution is RAC technology.
In RAC technology, each instance has its own LGWR, so this problem can be solved.
The Redo Log Buffer Cache is set to the beginning of the instance and can not be changed without restarting the instance. If you want to learn more about oracle background processes, you may want to read the article named “Oracle Background Processes”
Shared Pool
Shared Pool is the most complex part of SGA. It consists of many sub-structures. I will explain some of these.
The library cache
Records of parsed queries are stored in the library cache.
Thus, when a query is run again, it does not have to be parse again.
The performance gain is obtained because the parse operation is not repeated.
Parsing in Oracle
The processes of the parse process are as follows;
- Is there a table specified in the query?
- what columns are in the table if there is a “* FROM” expression in the query
- Does the user have the necessary permission?
- Should it use an index?
Once the parse operation is done, the query can be executed.
The data dictionary cache
Sometimes referred to as row cache.
The definitions of the last used objects (table, index, user, etc.) are stored.
These definitions can be read from memory by all sessions.
Thus, each session does not need to go to the data dictionary on disk to read these definitions.
Thus, the performance of the parsing process also increases.
The PL/SQL area
It is the memory area where “Stored PL/SQL objects” (procedures, functions, packaged procedures, packaged functions, object type definitions, and triggers) are stored.
Normally “stored PL/SQL objects” are stored in the data dictionary.
By storing these objects in the PL/SQL Area which is the part of the Shared Pool, you do not need to access these source codes every time from the data dictionary.
“Anonymous PL/SQLs” are not stored in the PL/SQL area of the shared pool.
Therefore, application developers should be encouraged to use Stored PL/SQL instead of Anonymous PL/SQL.
The SQL query and PL/SQL function result caches
The results of some SQL queries are stored in this area.
If the same query is called again, the cached value is returned.
Likewise, when a function is executed, the result of the function is stored here.
If the function is executed in the same way as the same parameter, the result stored in this area is returned.
Large Pool
An optional area in Memory.
Used for many operations (Shared Server Processes, Parallel Execution Server, Backup operations).
If you are using Shared Server and Parallel Execution Server, you should set up a large pool.
If not set, the shared pool is used, which can cause problems in the Shared Pool.
If a query that needs space in the Large Pool does not find the space it needs, it will fail.
If the large pool does not have the space needed for the query, it will not go to the shared pool.
If you give more memory to large pool, performance will not increase.
If you increase the Memory of the large pool, queries will be able to find the memory they need to work in the large pool.
Java Pool
You only need it if you are using Java Stored Procedures.
Streams Pool
Used for Oracle Streams.
You can see the current, minimum, and maximum sizes of the memory areas in the SGA with the following query.
1 2 | select COMPONENT,CURRENT_SIZE,MIN_SIZE,MAX_SIZE from v$sga_dynamic_components; |
PGA(Program Global Area)
It is a special memory area for processes.
Users connected to Oracle use this area as memory.
PGA_AGGREGATE_TARGET value gives the total pga available for that instance.
You can see this value with the below command while connected to the database.
1 | show parameter pga |
For other memory components, you can use the below command.
1 | show parameter mem |
The default value is 10 mb or 20% of the SGA.
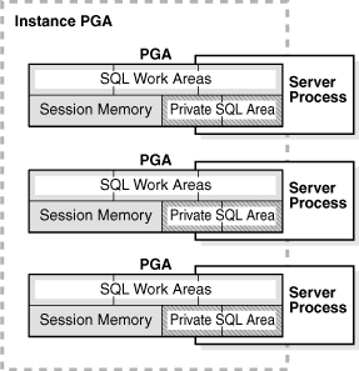
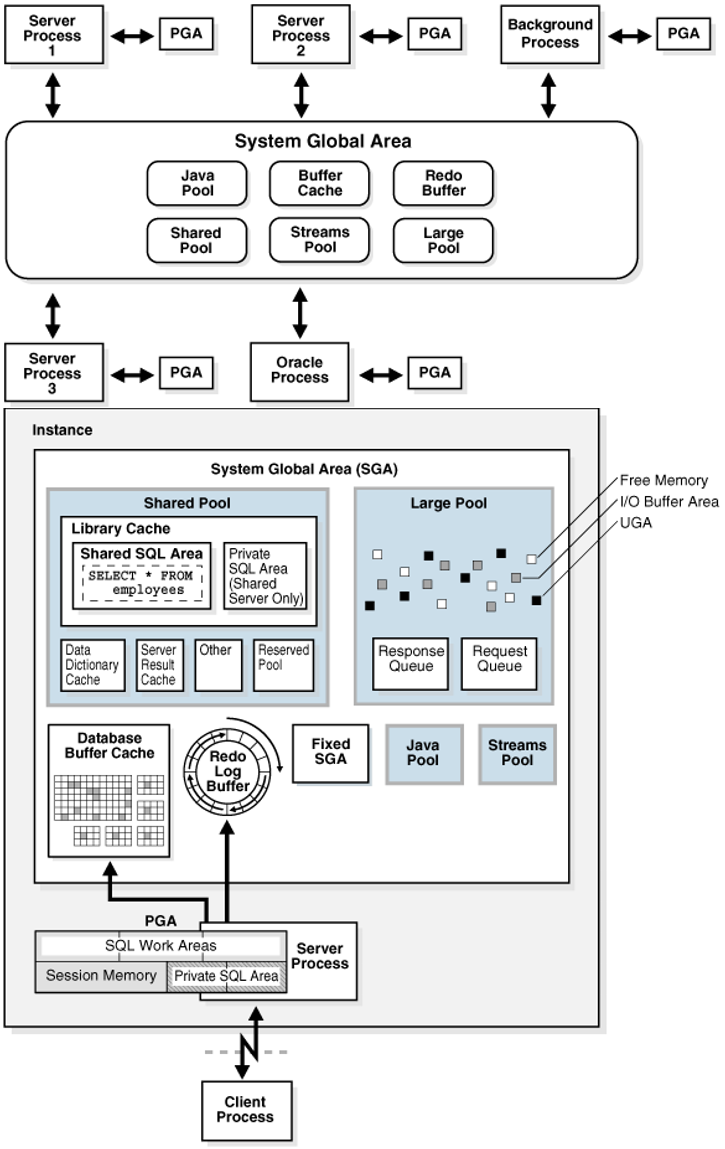
The following screen images from Oracle’s site can give you an idea of the PGA.


You can get an idea about SGA and PGA from the screenshots below.

You can see how much memory is allocated for the PGA with the following query.
1 2 | select name,value from v$pgastat where name in ('maximum PGA allocated','total PGA allocated'); |
![]()
 Database Tutorials MSSQL, Oracle, PostgreSQL, MySQL, MariaDB, DB2, Sybase, Teradata, Big Data, NOSQL, MongoDB, Couchbase, Cassandra, Windows, Linux