 Database Tutorials MSSQL, Oracle, PostgreSQL, MySQL, MariaDB, DB2, Sybase, Teradata, Big Data, NOSQL, MongoDB, Couchbase, Cassandra, Windows, Linux
Before installing MySQL instance, we must evaluate the CPU, Memory, Disk IO performance, Disk size, network of the server, also the maximal QPS(Query Per Second), concurrent threads and so on. Sysbench is a benchmark tool, it can be used to benchmark many items including the system and database. This article will introduce how to benchmark MySQL and disk IO performance.
1. Check the server information:
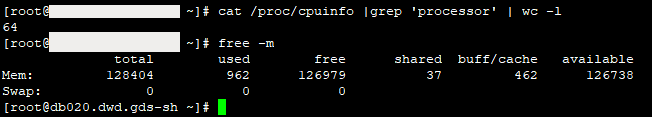
System:
CPU: 64 core(Intel(R) Xeon(R) Gold 6130 CPU @ 2.10GHz)
MEMORY: 128GB
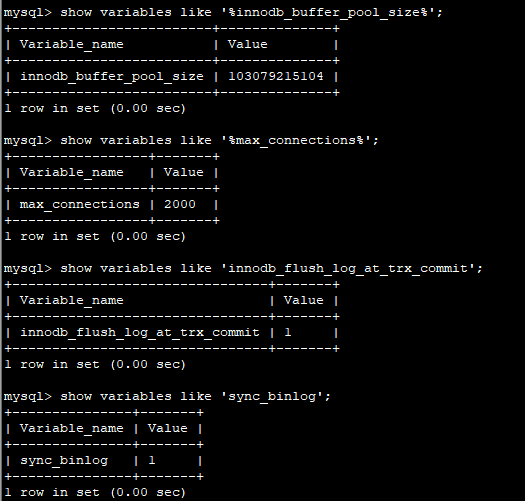
MySQL instance:
Version: 5.7.23
innodb_buffer_pool_size: 96GB
max_connections: 2000
innodb_flush_log_at_trx_commit: 1
sync_binlog: 1
2. Installing sysbench
(1) Quick install instructions
1 2 3 | yum -y install sysbench sysbench --version #sysbench 1.0.9 |
(2) Building and Installing From Source
We can also download sysbench package on the Github(https://github.com/akopytov/sysbench), and the README.md there shows how to install and use it.
3. File IO Benchmark
(1)Create files
To avoid the RAM tampers the benchmark result, we should create files bigger than the RAM size. So i create 150GB files at the data directory:
1 2 3 | cd /data1 sysbench --test=fileio --file-total-size=500G prepare |
This command will create a total of 500GB of files(default: 128 files)
To avoid the influence of RAM caching, we need to set ‘–file-total-size‘ to be larger than RAM.
(2)IO benchmark
1 | sysbench --test=fileio --file-total-size=500G --file-test-mode=rndrw --init-rng=on --max-time=300 --max-requests=0 run |
1 2 3 4 5 6 7 8 9 10 11 12 13 14 15 16 17 18 19 20 21 22 23 24 25 26 27 28 29 30 31 32 33 34 35 36 37 | File operations: reads/s: 16121.01 writes/s: 10747.29 fsyncs/s: 34390.58 Throughput: read, MiB/s: 251.89 written, MiB/s: 167.93 General statistics: total time: 300.0049s total number of events: 18378137 Latency (ms): min: 0.00 avg: 1.04 max: 22.06 95th percentile: 4.10 sum: 19163038.42 Threads fairness: events (avg/stddev): 287158.3906/763.93 execution time (avg/stddev): 299.4225/0.01 |
4. MySQL OLTP(On-Line Transaction Processing) Benchmark
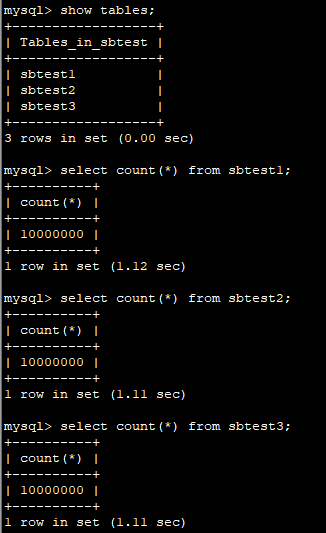
(1)Prepare tables and rows
1 | sysbench /usr/share/sysbench/oltp_read_write.lua --mysql-host=10.1.0.20 --mysql-port=5701 --mysql-user=sbtest --mysql-password='sbtestpwd' --mysql-db=sbtest --db-driver=mysql --tables=3 --table-size=10000000 prepare |
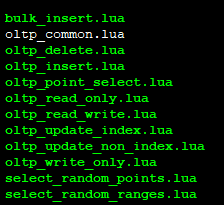
(2)Run benchmark
There are many LUA scripts in the /usr/share/sysbench directory, and you can choose a suitable one to have the benchmark.
1 | sysbench /usr/share/sysbench/oltp_read_write.lua --mysql-host=10.1.0.20 --mysql-port=5701 --mysql-user=sbtest --mysql-password='sbtestpwd' --mysql-db=sbtest --db-driver=mysql --tables=3 --table-size=10000000 --report-interval=10 --threads=128 --time=600 run 2>&1 |
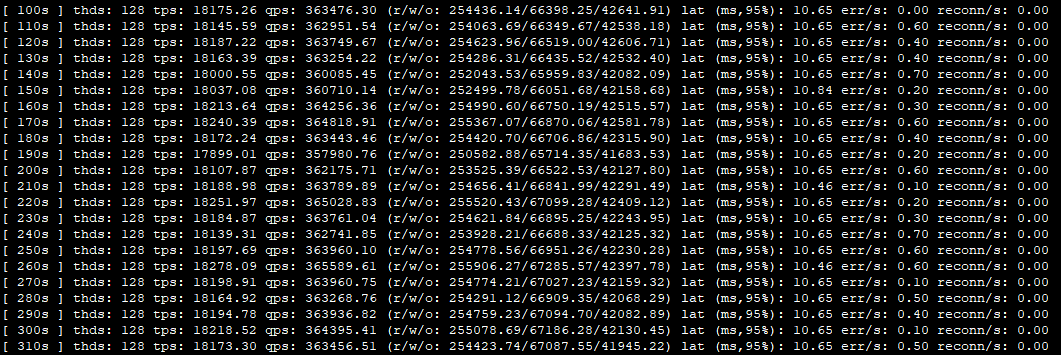
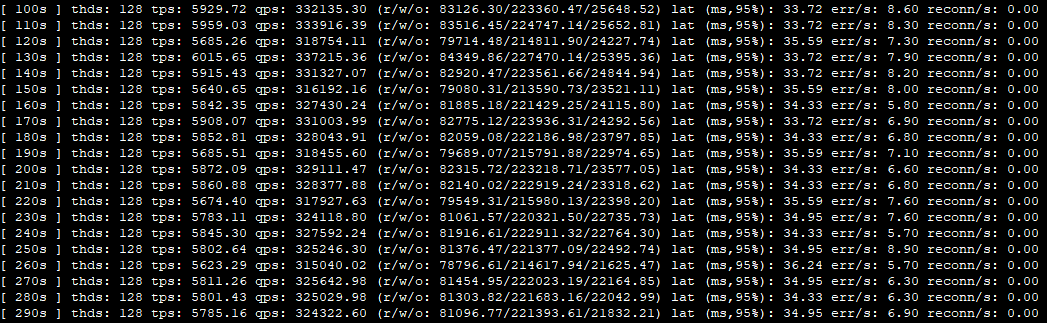
Report intermediate results every 10 second(s)
Running time: 600 seconds
While running sysbench, we can check some status. Look at the top status, the mysqld process uses almost 48 cores of CPU and 14% of memory(about 18 GB).
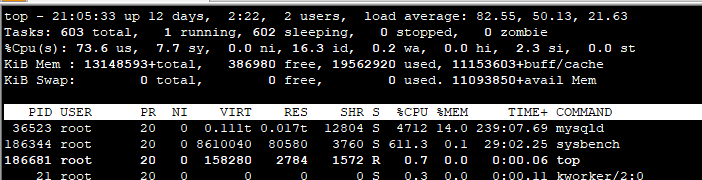
1 | top status |
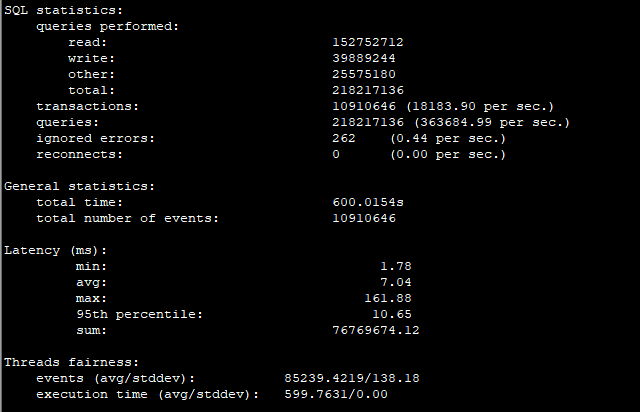
You can get the TPS(18183.90)/QPS(363684.99), total transactions, total queries(including read and write), how many errors happened from the report. Also you can find the latency metrics(95%: 10.65 ms) and the query distribution.
If you write a lot, then you can increase the INSERT/UPDATE/DELDETE queries per transaction, then set different number of queries per transaction, depend on the usage cases. For example,
1 | sysbench /usr/share/sysbench/oltp_read_write.lua --mysql-host=10.1.0.20 --mysql-port=5701 --mysql-user=sbtest --mysql-password='sbtestpwd' --mysql-db=sbtest --db-driver=mysql --tables=3 --table-size=10000000 --delete_inserts=10 --index_updates=10 --non_index_updates=10 --report-interval=10 --threads=128 --time=600 run |
The report shows that there are more writes per transaction.
Get more information by:
1 | sysbench /usr/share/sysbench/oltp_read_write.lua help |
Then we can roughly estimate if this system and MySQL instance is enough for our usage, it must be much better than our needs, because the queries are more complicated at the production environment, and these queries require more system resources to execute.
![]()
all pics are gone. WTF
Thank you. We will fix it soon.