 Database Tutorials MSSQL, Oracle, PostgreSQL, MySQL, MariaDB, DB2, Sybase, Teradata, Big Data, NOSQL, MongoDB, Couchbase, Cassandra, Windows, Linux
Hello Everyone , I am back with next part of Database monitoring .
You should read the first article of this series. “DB2-Database Monitoring-1”
I have been preparing db2 materials for learners or freshers.Therefore, this materials contains very basic language to make understand everyone.
Currently, many are performance monitoring tool has been introduced from v8.x to v11.x.On daily basis ,we all are learning something new.
Currently most important performance monitoring tool introduce is DSM (Data Server Manager).
Recently I learned about a neat DB2 monitoring tool and I wanted to share it with you all.
< DSM Tool>
The Data Server Manager (DSM) tool has a simple install and a no-charge option that allows you to monitor a DB2 database in real time. You can see active SQLs, locks, package cache statistics, and most of the key metrics you use for day-to-day database performance work.
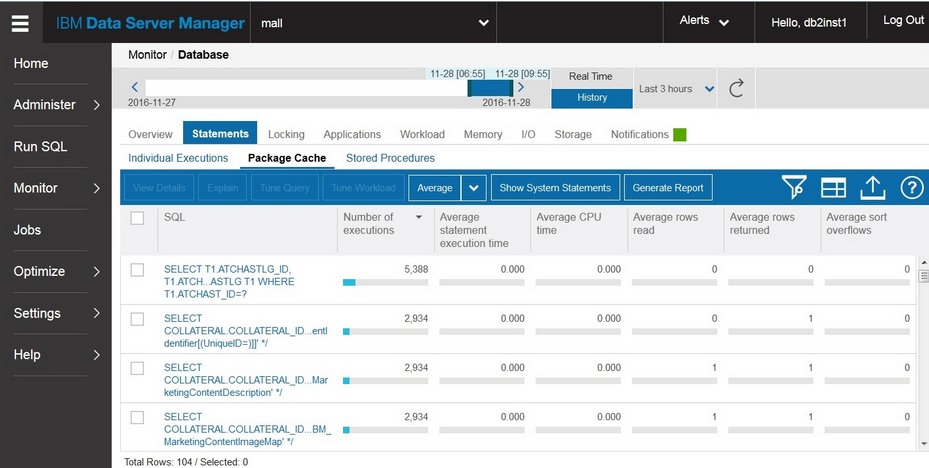
DSM also comes in the Enterprise edition that, among other things, enables you to monitor multiple databases and to look at historical data (e.g. “Top 10 SQLs during yesterday’s outage” ).
Here is the link to explore more :
1. http://www.db2dean.com/Previous/DSM1.html
2.https://www.ibm.com/developerworks/data/library/techarticle/dm-1503db2-data-server/index.html
< Snapshot >
Notes:
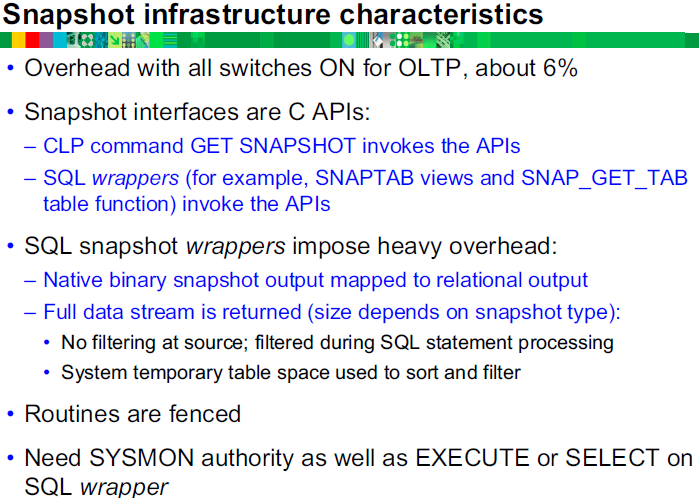
The overhead associated with collecting the detailed snapshot statistics varies depending on the application workload. A test performed using a OLTP transaction system showed that about 6 percent overhead was added if all of the snapshot switches were turned on.
The snapshot monitoring facilities are based on a set of C programming language API calls. The SQL wrappers that provide the results for the DB2 snapshot based administrative functions and views utilize the same C based API calls which are executed as fenced routines. These routines use the Snapshot API calls to retrieve a complete set of statistics and then filter the data to match the specific SQL statement.
So a SQL statement might request a few data elements for one table space, but all the detailed information about every table space would be collected and brought into memory. In some cases, system temporary table space would be used to produce the results.
In order to access the snapshot-based statistics using the SQL functions or views a user needs to be a member of one of the DB2 instance level group authorizations, SYSADM, SYSCTRL, SYSMAINT or SYSMON.
<Memory metrics>
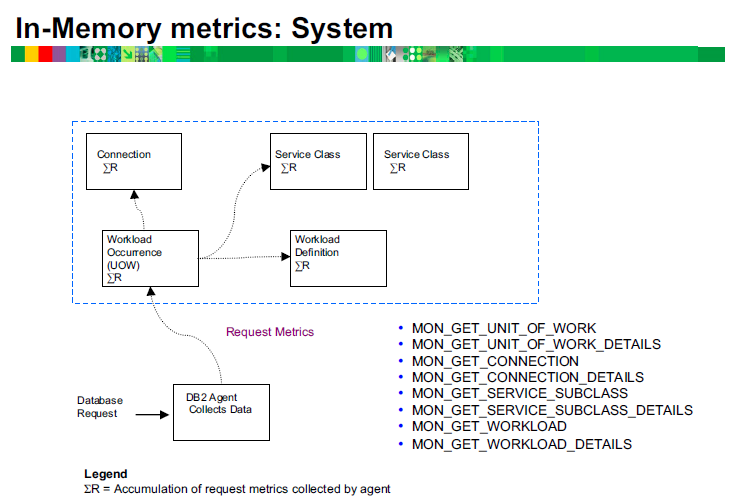
Notes:
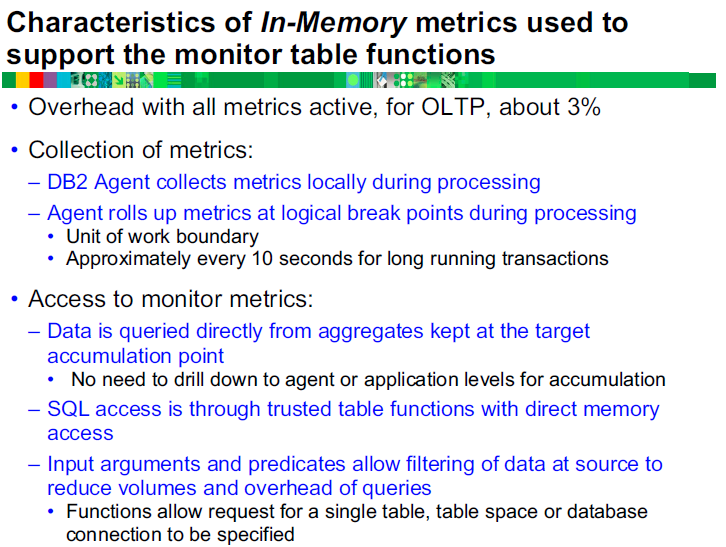
As application requests are processed by the database manager, the various statistics are added to each level used for reporting.
The detailed processing metrics are added to the specific unit of work that generated the database request. Each unit of work is added to the statistics for the connection associated with the unit of work.
The statistics are also added to the workload and service subclass that the request was processed under.
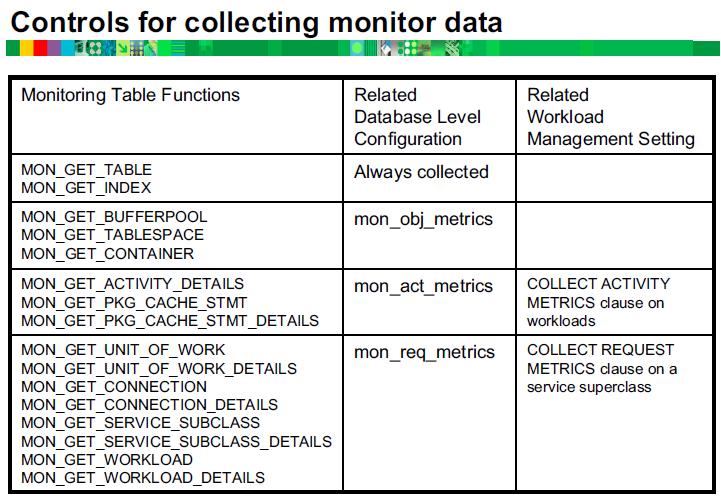
- Monitoring system information using table functions :
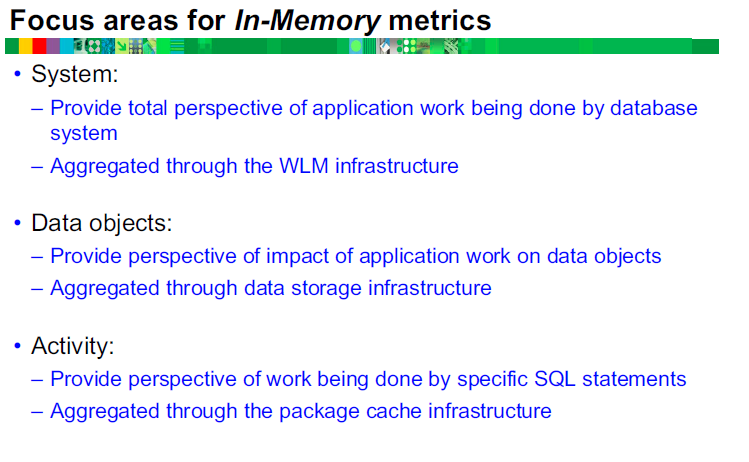
•The system monitoring perspective encompasses all the work and effort expended by the data server to process application requests.
•You can determine what the data server is doing as a whole or for particular subsets of application requests.
•Table functions are provided in pairs:
–One returns the most commonly used metrics in a column-based format and is the most performance efficient method of retrieving metrics.
–One (DETAILS) returns the entire set of available metrics in an XML document format, which provides maximum flexibility for formatting output.
–Use the following table functions for accessing current system monitoring information:
•MON_GET_SERVICE_SUBCLASS and MON_GET_SERVICE_SUBCLASS_DETAILS
•MON_GET_WORKLOAD and MON_GET_WORKLOAD_DETAILS
•MON_GET_CONNECTION and MON_GET_CONNECTION_DETAILS
•MON_GET_UNIT_OF_WORK and MON_GET_UNIT_OF_WORK_DETAILSMonitoring
The system monitoring information is collected by these table functions by default for a new database. You can change default settings using one or both of the following settings:
•The database configuration parameter mon_req_metrics specifies the minimum level of collection in all service classes.
•The COLLECT REQUEST METRICS clause of the CREATE/ALTER SERVICE CLASS statement specifies the level of collection for a service super-class. Use this setting to increase the level of collection for a given service class over the minimum level of collection set for all service classes.
The possible values for each setting are the following:
-None – No request monitor elements are collected
-Base – All request monitor elements are collected
For example, to collect system monitoring information for only a subset of service classes, do the following:
•Set the database configuration parameter mon_req_metrics to NONE.
•For each desired service class, set the COLLECT REQUEST METRICS clause of the CREATE/ALTER SERVICE CLASS statement to BASE.
Note :
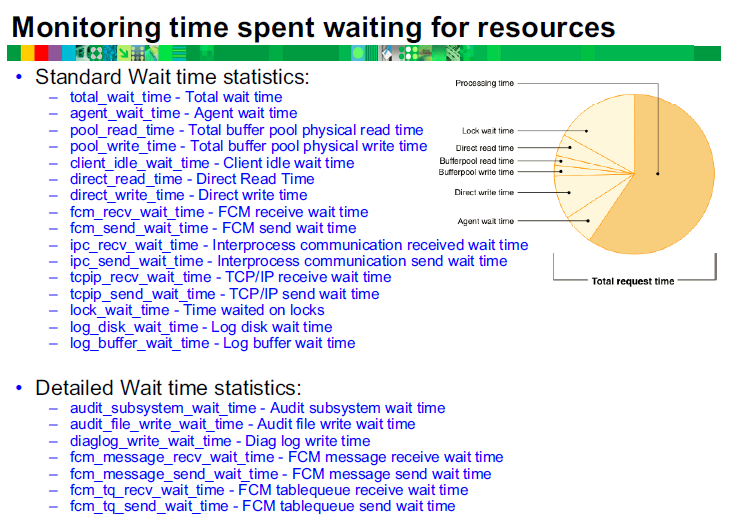
Elapsed time is not the same as elapsed time as measured on a clock; if the overall time spent was split among multiple threads, the time spent in each thread is represented in this number.
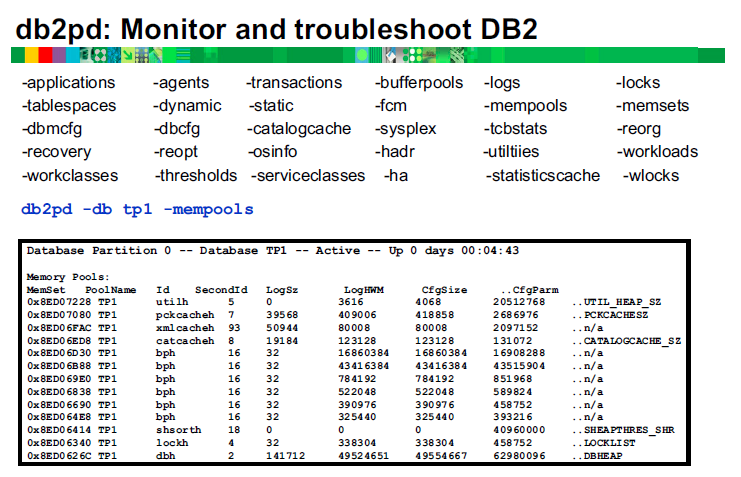
< db2pd >
Here,comes most important monitoring tool is DB2pd, which is very useful in all the db2 versions.We all have been using this tool for troubleshoot an any issue.
Notes:
Listing of OS processes and threads has changed (Linux and UNIX):
Due to the move to the multithreaded architecture in DB2 Version 9.5, the output for the ps command has changed.
Also, the db2pd command has -edus option lists all engine dispatchable units (EDUs) for a database partition.
To display the individual threads associated with the db2sysc process, you must use the applicable thread options on the ps command. On the Linux operating system, for example, you can use the -lLfp option. On the AIX operating system, you can use the -m -o THREAD options.
Example
1. The ps -fu command now displays only two processes, as shown in the following example:
1 2 3 4 5 6 | $ ps -fu lpham UID PID PPID C STIME TTY TIME CMD lpham 25996 25946 0 12:19 pts/12 00:00:00 -ksh lpham 27688 27676 0 12:21 pts/12 00:01:46 db2sysc lpham 27716 27676 0 12:21 pts/12 00:00:00 db2acd lpham 29321 26567 0 12:30 pts/12 00:00:00 ps -fu lpham |
2. db2pd –db testdb–storagegroupsDatabase
Using this command -storagegroups option of the db2pd command. The report show the current default storage group and the paths assigned to each storage group.
Unit summary :
Having completed this unit, you should be able to:
•DSM tool: Manage performance and administer DB2 databases using IBM Data Server Manager
•Compare the infrastructure used to support SNAPSHOT monitoring with the monitoring infrastructure introduced in DB2 9.7
•Configure a database to collect the activity and object metrics returned by the Monitoring Table functions
•Use the db2pd to perform performance analysis or problem determination for a DB2 database
•Utilize the DB2 provided table functions and views with SQL in reporting and monitoring of the database system, data objects, and the package cache to help you quickly identify issues that might be causing problems
•Configure the DB2 Database configuration options that control the collection of request, activity and object level metrics on the entire database
And here completes database monitoring unit.
Thank you all for your support
![]()
Excellent.