 Database Tutorials MSSQL, Oracle, PostgreSQL, MySQL, MariaDB, DB2, Sybase, Teradata, Big Data, NOSQL, MongoDB, Couchbase, Cassandra, Windows, Linux
Today I will give you information about Fast Start Failover -SINGLE NODE.
1. We check the broker’s configuration to see if everything is normal.
1 2 3 4 5 6 7 8 9 10 11 12 13 14 15 16 17 18 | DGMGRL> show configuration Configuration - DG_Solution Protection Mode: MaxPerformance Members: primary - Primary database prmyFS - Far sync instance physical - Physical standby database logical - Logical standby database Members Not Receiving Redo: physclFS - Far sync instance Fast-Start Failover: DISABLED Configuration Status: SUCCESS (status updated 42 seconds ago) |
2. We check whether Flashback is enabled in Primary and Standby Databases.
1 2 3 4 5 6 7 8 9 10 11 12 13 14 15 16 17 18 19 | [Primary] SQL> select flashback_on from v$database; FLASHBACK_ON ------------------ NO [Physical] SQL> select flashback_on from v$database; FLASHBACK_ON ------------------ NO [Logical] SQL> select flashback_on from v$database; FLASHBACK_ON ------------------ NO |
3. We control the duration that Flashback Logs will be stored.
1 2 3 4 5 6 7 8 9 10 11 12 13 14 15 16 17 18 19 | [Primary] SQL> show parameter db_flashback_retention NAME TYPE VALUE ------------------------------------ ----------- ------------------------------ db_flashback_retention_target integer 1440 [Physical] SQL> show parameter db_flashback_retention NAME TYPE VALUE ------------------------------------ ----------- ------------------------------ db_flashback_retention_target integer 1440 [Logical] SQL> show parameter db_flashback_retention NAME TYPE VALUE ------------------------------------ ----------- ------------------------------ db_flashback_retention_target integer 1440 |
4. We check whether there is enough space in the location where Flashback Logs will be stored.
1 2 3 4 5 6 7 8 9 10 11 12 13 14 15 16 17 18 19 20 21 22 | [Primary] SQL> show parameter db_recovery NAME TYPE VALUE ------------------------------------ ----------- ------------------------------ db_recovery_file_dest string /u01/app/oracle/recovery_area db_recovery_file_dest_size big integer 10G [Physical] SQL> show parameter db_recovery NAME TYPE VALUE ------------------------------------ ----------- ------------------------------ db_recovery_file_dest string /u01/app/oracle/recovery_area db_recovery_file_dest_size big integer 10G [Logical] SQL> show parameter db_recovery NAME TYPE VALUE ------------------------------------ ----------- ------------------------------ db_recovery_file_dest string /u01/app/oracle/recovery_area db_recovery_file_dest_size big integer 10G |
5. Before activating Flashback, we stop Log Apply operations on Standby Databases.
1 2 3 4 5 6 7 8 9 10 11 12 13 | [oracle@primary ~]$ dgmgrl DGMGRL for Linux: Version 12.1.0.2.0 - 64bit Production Copyright (c) 2000, 2013, Oracle. All rights reserved. Welcome to DGMGRL, type "help" for information. DGMGRL> connect sysdg Password: Connected as SYSDG. DGMGRL> edit database physical set state='APPLY-OFF'; Succeeded. DGMGRL> edit database logical set state='APPLY-OFF'; Succeeded. |
If I did it with SQL, I would use the following commands.
1 2 | [Physical] SQL> alter database recover managed standby database cancel; [Logical] SQL> alter database stop logical standby apply; |
6. We enable Flashback feature in Primary and Standby Databases.
1 2 3 4 5 6 7 8 9 10 11 | DGMGRL> sql "alter database flashback on"; Succeeded. DGMGRL> connect sysdg/Passw0rd4@physical Connected as SYSDG. DGMGRL> sql "alter database flashback on"; Succeeded. DGMGRL> connect sysdg/Passw0rd4@logical Connected as SYSDG. DGMGRL> sql "alter database flashback on"; Succeeded. DGMGRL> |
The reason we put this feature into use is that the databases other than the Primary Database, which will be Disabled after Failover, and the Fast-Start Failover Target Standby database, can successfully perform the necessary roles again with Flashback Logs.
Otherwise I would have to create these databases again.
I could also do this with SQL from SQLPLUS, but after the Broker configuration, I will need to manage the Data Guard Environment from the Broker, so I do it from the Broker for the sake of hand.
7. We check whether the flashback feature is enabled in the databases.
1 2 3 4 5 6 7 8 9 10 11 12 13 14 15 16 17 | [Primary] SQL> select flashback_on from v$database; FLASHBACK_ON ------------------ YES [Physical] SQL> select flashback_on from v$database; FLASHBACK_ON ------------------ YES [Logical] SQL> select flashback_on from v$database; FLASHBACK_ON ------------------ YES |
8. It is checked whether Flashback Logs have started to occur.
1 2 3 4 5 6 7 8 9 10 11 12 13 14 15 16 17 18 19 20 21 22 23 24 25 26 27 28 29 30 31 32 33 34 35 36 37 38 39 40 41 42 43 44 45 46 | [Primary] SQL> select file_type,number_of_files,percent_space_used from v$recovery_area_usage; FILE_TYPE NUMBER_OF_FILES PERCENT_SPACE_USED ----------------------- --------------- ------------------ CONTROL FILE 0 0 REDO LOG 0 0 ARCHIVED LOG 95 6.33 BACKUP PIECE 0 0 IMAGE COPY 0 0 FLASHBACK LOG 2 .98 FOREIGN ARCHIVED LOG 0 0 AUXILIARY DATAFILE COPY 0 0 8 rows selected. [Physical] SQL> select file_type,number_of_files,percent_space_used from v$recovery_area_usage; FILE_TYPE NUMBER_OF_FILES PERCENT_SPACE_USED ----------------------- --------------- ------------------ CONTROL FILE 0 0 REDO LOG 0 0 ARCHIVED LOG 95 6.33 BACKUP PIECE 0 0 IMAGE COPY 0 0 FLASHBACK LOG 2 .98 FOREIGN ARCHIVED LOG 0 0 AUXILIARY DATAFILE COPY 0 0 8 rows selected. [Logical] SQL> select file_type,number_of_files,percent_space_used from v$recovery_area_usage; FILE_TYPE NUMBER_OF_FILES PERCENT_SPACE_USED ----------------------- --------------- ------------------ CONTROL FILE 0 0 REDO LOG 0 0 ARCHIVED LOG 59 18.66 BACKUP PIECE 0 0 IMAGE COPY 0 0 FLASHBACK LOG 2 .98 FOREIGN ARCHIVED LOG 67 3.54 AUXILIARY DATAFILE COPY 0 0 8 rows selected. |
9. Current Flashback Size is also checked.
1 2 3 4 5 6 7 8 9 10 11 12 13 14 15 16 17 18 19 | [Primary] SQL> select flashback_size from v$flashback_database_log; FLASHBACK_SIZE -------------- 104857600 [Physical] SQL> select flashback_size from v$flashback_database_log; FLASHBACK_SIZE -------------- 104857600 [Logical] SQL> select flashback_size from v$flashback_database_log; FLASHBACK_SIZE -------------- 104857600 |
That’s equivalent to 100MB. This is allocate to you when it is created in Default. It increases according to Flaschback_Retention time.
10. We start Log Apply operations on Standby Databases.
1 2 3 4 | DGMGRL> edit database physical set state='APPLY-ON'; Succeeded. DGMGRL> edit database logical set state='APPLY-ON'; Succeeded. |
11. We check if the Log Apply processes have started.
1 2 3 4 5 6 7 8 9 10 11 12 13 14 15 16 17 18 19 20 21 22 23 24 25 26 27 28 29 30 | DGMGRL> show database physical Database - physical Role: PHYSICAL STANDBY Intended State: APPLY-ON Transport Lag: 0 seconds (computed 1 second ago) Apply Lag: 0 seconds (computed 1 second ago) Average Apply Rate: 10.00 KByte/s Real Time Query: ON Instance(s): physical Database Status: SUCCESS DGMGRL> show database logical Database - logical Role: LOGICAL STANDBY Intended State: APPLY-ON Transport Lag: 0 seconds (computed 0 seconds ago) Apply Lag: 0 seconds (computed 0 seconds ago) Active Apply Rate: 0 Byte/s Instance(s): logical Database Status: SUCCESS |
12. A new table is created under the TEST user to check whether the Log Apply processes have started.
1 2 3 4 5 6 7 8 9 10 11 12 13 14 15 16 17 18 19 20 21 22 23 24 25 26 27 28 29 30 | [Primary] SQL> create table test.regions_yedek as select * from hr.regions; Table created. [Primary] SQL> select table_name from dba_tables where owner='TEST'; TABLE_NAME -------------------------------------------------------------------------------- DEPARTMENTS_YEDEK REGIONS_YEDEK JOBS_YEDEK EMPLOYEES_YEDEK [Physical] SQL> select table_name from dba_tables where owner='TEST'; TABLE_NAME -------------------------------------------------------------------------------- DEPARTMENTS_YEDEK REGIONS_YEDEK JOBS_YEDEK EMPLOYEES_YEDEK [Logical] SQL> select table_name from dba_tables where owner='TEST'; TABLE_NAME -------------------------------------------------------------------------------- JOBS_YEDEK EMPLOYEES_YEDEK DEPARTMENTS_YEDEK REGIONS_YEDEK |
13. Finally, we check the RedoRoutes parameters to see if the logs will go according to the desired architecture.
1 2 3 4 5 6 7 8 9 10 | DGMGRL> show database primary 'RedoRoutes'; RedoRoutes = '(primary:prmyFS SYNC)' DGMGRL> show database physical 'RedoRoutes'; RedoRoutes = '(physical:physclFS SYNC)' DGMGRL> show database logical 'RedoRoutes'; RedoRoutes = '' DGMGRL> show far_sync 'prmyFS' 'RedoRoutes'; RedoRoutes = '(primary:physical,logical ASYNC)' DGMGRL> show far_sync 'physclFS' 'RedoRoutes'; RedoRoutes = '(physical:primary,logical ASYNC)' |
14. Now we start the parameter adjustments for Fast-Start Failover operations.
a. Target Standby Database is determined for Fast-start Failover.
1 2 3 4 5 | DGMGRL> edit database primary set property 'FastStartFailoverTarget'='physical'; Property "FastStartFailoverTarget" updated DGMGRL> show database primary FastStartFailoverTarget FastStartFailoverTarget = 'physical' |
b. After the role change, Fast-start Failover Target Standby Database is determined.
1 2 3 4 5 | DGMGRL> edit database physical set property 'FastStartFailoverTarget'='primary'; Property "FastStartFailoverTarget" updated DGMGRL> show database physical 'FastStartFailoverTarget'; FastStartFailoverTarget = 'primary' |
c. It is determined how often the Observer will establish a connection with the Primary Database.
1 2 | DGMGRL> edit configuration set property ObserverReconnect=120; Property "observerreconnect" updated |
I don’t think so much parameter changes are necessary for now and I don’t make any other changes.
15. Before enabling Fast-start Failover, we check the status of the parameters one last time.
1 2 3 4 5 6 7 8 9 10 11 12 13 14 15 16 17 18 19 20 21 22 23 | DGMGRL> show fast_start failover Fast-Start Failover: DISABLED Threshold: 30 seconds Target: (none) Observer: (none) Lag Limit: 30 seconds Shutdown Primary: TRUE Auto-reinstate: TRUE Observer Reconnect: 120 seconds Observer Override: FALSE Configurable Failover Conditions Health Conditions: Corrupted Controlfile YES Corrupted Dictionary YES Inaccessible Logfile NO Stuck Archiver NO Datafile Offline YES Oracle Error Conditions: (none) |
Observer is not START yet, so it cannot be seen on which HOST it is running. Also, Target parameter will be seen after Fast-start Failover ENABLE.
16. We ENABLE the broker.
1 2 3 4 | DGMGRL> enable fast_start failover; Error: ORA-16693: requirements not met for enabling fast-start failover Failed. |
The reason for this error is that although we use Far SYNC in the Data Guard Environment, the current Protection Mode is Max Performance. Protection Mode must be Maximum Availability.
17. We make Protection Mode Maximum Availability.
1 2 | DGMGRL> edit configuration set protection mode as maxavailability; Succeded. |
18. The broker is requested to be ENABLEd again.
1 2 | DGMGRL> enable fast_start failover Enabled. |
19. We are questioning the status of Fast-start Failover.
1 2 3 4 5 6 7 8 9 10 11 12 13 14 15 16 17 18 19 20 21 22 23 | DGMGRL> show fast_start failover Fast-Start Failover: ENABLED Threshold: 30 seconds target: physical Observer: (none) Lag Limit: 30 seconds (not in use) Shutdown Primary: TRUE Auto-reinstate: TRUE Observer Reconnect: 120 seconds Observer Override: FALSE Configurable Failover Conditions Health Conditions: Corrupted Controlfile YES Corrupted Dictionary YES Inaccessible Logfile NO Stuck Archiver NO Datafile Offline YES Oracle Error Conditions: (none) |
The reason why it says “not in use” in the Lag Limit parameter is that this parameter is used while in Maximum Performance mode.
20. We query the status of the broker configuration.
1 2 3 4 5 6 7 8 9 10 11 12 13 14 15 16 17 18 19 20 21 22 | DGMGRL> show configuration Configuration - DG_Solution Protection Mode: MaxAvailability Members: primary - Primary database Warning: ORA-16819: fast-start failover observer not started prmyFS - Far sync instance physical - (*) Physical standby database Warning: ORA-16819: fast-start failover observer not started logical - Logical standby database Members Not Receiving Redo: physclFS - Far sync instance Fast-Start Failover: ENABLED Configuration Status: WARNING (status updated 11 seconds ago) |
The reason for these warnings is that the Observer has not been started yet.
21. The Observer is started.
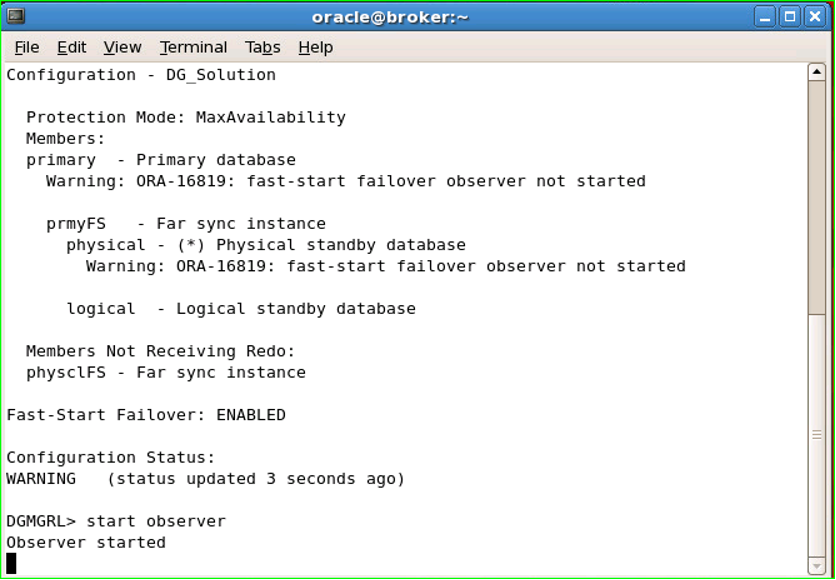
Since the Observer is a foreground process, it constantly occupies the DGMGRL prompt it is running, and we can see all the processes it captures and the jobs it does from this prompt.
For this reason, it is useful to connect from a different computer. In addition, since it will follow the Primary and Standby Databases, it should not be run in these databases. That’s why I run it in Primary Far_SYNC.
22. We are questioning the status of Fast-start Failover again.
1 2 3 4 5 6 7 8 9 10 11 12 13 14 15 16 17 18 19 20 21 22 23 | DGMGRL> show fast_start failover Fast-Start Failover: ENABLED Threshold: 30 seconds Target: physical Observer: broker.tivibulab.local Lag Limit: 30 seconds (not in use) Shutdown Primary: TRUE Auto-reinstate: TRUE Observer Reconnect: 120 seconds Observer Override: FALSE Configurable Failover Conditions Health Conditions: Corrupted Controlfile YES Corrupted Dictionary YES Inaccessible Logfile NO Stuck Archiver NO Datafile Offline YES Oracle Error Conditions: (none) |
I ran Observer from a completely separate instance. This is not mandatory. As I mentioned before, it can also be run from Far SYNC instances.
23. The broker configuration is also queried again.
1 2 3 4 5 6 7 8 9 10 11 12 13 14 15 16 17 18 | DGMGRL> show configuration Configuration - DG_Solution Protection Mode: MaxAvailability Members: primary - Primary database prmyFS - Far sync instance physical - (*) Physical standby database logical - Logical standby database Members Not Receiving Redo: physclFS - Far sync instance Fast-Start Failover: ENABLED Configuration Status: SUCCESS (status updated 46 seconds ago) |
(*) Indicates Fast-start Failover Target Standby Database.
24. Fast-start Failover is triggered by closing Primary Database with Shutdown Abort.
1 2 3 | [Primary] SQL> shu abort; Oracle instance shutdown |
25. Follow the steps during the Failover process from the computer where the Observer is started.
1 2 3 4 5 6 7 8 9 10 11 12 13 14 15 16 17 18 19 20 21 22 23 24 25 26 27 28 29 30 31 32 33 34 35 | DGMGRL> start observer Observer started 13:57:24.56 Saturday, February 11, 2017 Initiating Fast-Start Failover to database "physical"... Performing failover NOW, please wait... Failover succeeded, new primary is "physical" 13:58:43.37 Saturday, February 11, 2017 13:58:44.41 Saturday, February 11, 2017 Initiating reinstatement for database "logical"... Reinstating database "logical", please wait... Operation requires shut down of instance "logical" on database "logical" Shutting down instance "logical"... Database closed. Database dismounted. ORACLE instance shut down. Operation requires start up of instance "logical" on database "logical" Starting instance "logical"... ORACLE instance started. Database mounted. Continuing to reinstate database "logical" ... Operation requires shut down of instance "logical" on database "logical" Shutting down instance "logical"... ORA-01109: database not open Database dismounted. ORACLE instance shut down. Operation requires start up of instance "logical" on database "logical" Starting instance "logical"... ORACLE instance started. Database mounted. Continuing to reinstate database "logical" ... Reinstatement of database "logical" succeeded 14:00:25.56 Saturday, February 11, 2017 |
26. Failover operation completed successfully. We pass to the controls.
a. The broker configuration is queried to see if there is an error.
1 2 3 4 5 6 7 8 9 10 11 12 13 14 15 16 17 18 19 20 21 22 | DGMGRL> show configuration Configuration - DG_Solution Protection Mode: MaxAvailability Members: physical - Primary database Warning: ORA-16817: unsynchronized fast-start failover configuration physclFS - Far sync instance primary - (*) Physical standby database (disabled) ORA-16661: the standby database needs to be reinstated logical - Logical standby database Members Not Receiving Redo: prmyFS - Far sync instance Fast-Start Failover: ENABLED Configuration Status: WARNING (status updated 27 seconds ago) |
The reason for this warning is that the Original Primary Database is disabled and is not synchronized with the New Primary.
The reason for the error is that the Original Primary needs the Reinstate operation.
b. The statuses of the databases are queried.
1 2 3 4 5 6 7 8 9 10 11 12 13 14 15 16 17 18 19 20 21 22 23 24 25 26 27 28 29 30 31 | [oracle@primary ~]$ sqlplus / as sysdba SQL*Plus: Release 12.1.0.2.0 Production on Sat Feb 11 14:01:16 2017 Copyright (c) 1982, 2014, Oracle. All rights reserved. Connected to an idle instance. [Physical] SQL> select status from v$instance; STATUS ------------ OPEN [PhysicalFS] SQL> select status from v$instance; STATUS ------------ MOUNTED [Logical] SQL> select status from v$instance; STATUS ------------ OPEN [PrimaryFS] SQL> select status from v$instance; STATUS ------------ MOUNTED |
c. Databases’ open_mode, roles and protection modes are queried.
1 2 3 4 5 6 7 8 9 10 11 12 13 14 15 16 17 18 19 20 21 22 23 | [Physical] SQL> select open_mode, database_role, protection_mode from v$database; OPEN_MODE DATABASE_ROLE PROTECTION_MODE -------------------- ---------------- -------------------- READ WRITE PRIMARY MAXIMUM AVAILABILITY [Logical] SQL> select open_mode, database_role, protection_mode from v$database; OPEN_MODE DATABASE_ROLE PROTECTION_MODE -------------------- ---------------- -------------------- READ WRITE LOGICAL STANDBY MAXIMUM AVAILABILITY [PhysicalFS] SQL> select open_mode, database_role, protection_mode from v$database; OPEN_MODE DATABASE_ROLE PROTECTION_MODE -------------------- ---------------- -------------------- MOUNTED FAR SYNC MAXIMUM AVAILABILITY [PrimaryFS] SQL> select open_mode, database_role, protection_mode from v$database; OPEN_MODE DATABASE_ROLE PROTECTION_MODE -------------------- ---------------- -------------------- MOUNTED FAR SYNC MAXIMUM AVAILABILITY |
d. It is questioned whether the Log Switch operation has been carried out successfully. For this, first RESETLOGS_TIME is learned. This is because databases eat OPEN RESETLOGS and the log sequence numbers change.
1 2 3 4 5 6 7 8 9 10 11 12 13 14 15 16 | [Physical] SQL> select RESETLOGS_TIME from v$database; RESETLOGS --------- 11-FEB-17 [Physical] SQL> alter session set nls_date_format='dd-mm-yyyy hh24:mi:ss'; Session altered. [Physical] SQL> select RESETLOGS_TIME from v$database; RESETLOGS_TIME ------------------- 11-02-2017 13:58:39 |
e. Existing log sequence numbers are queried.
1 2 3 4 5 6 7 8 9 10 11 12 13 14 15 16 17 | [Physical] SQL> select max(sequence#),thread# from v$archived_log where first_time > to_date('11/02/2017 13:58:39', 'DD-MM-YYYY HH24:MI:SS') group by thread#; MAX(SEQUENCE#) THREAD# -------------- ---------- 28 1 [Logical] SQL> select max(sequence#),thread# from dba_logstdby_log where first_time > to_date('11/02/2017 13:58:39', 'DD-MM-YYYY HH24:MI:SS') group by thread#; MAX(SEQUENCE#) THREAD# -------------- ---------- 28 1 [PhysicalFS] SQL> select max(sequence#),thread# from v$archived_log where first_time > to_date('11/02/2017 13:58:39', 'DD-MM-YYYY HH24:MI:SS') group by thread#; MAX(SEQUENCE#) THREAD# -------------- ---------- 28 1 |
f. Log Switch operation is performed and log sequence numbers are checked.
1 2 3 4 5 6 7 8 9 10 11 12 13 14 15 16 17 18 19 20 21 | [Physical] SQL> alter system switch logfile; System altered. [Physical] SQL> select max(sequence#),thread# from v$archived_log where first_time > to_date('11/02/2017 13:58:39', 'DD-MM-YYYY HH24:MI:SS') group by thread#; MAX(SEQUENCE#) THREAD# -------------- ---------- 30 1 [Logical] SQL> select max(sequence#),thread# from dba_logstdby_log where first_time > to_date('11/02/2017 13:58:39', 'DD-MM-YYYY HH24:MI:SS') group by thread#; MAX(SEQUENCE#) THREAD# -------------- ---------- 30 1 [PhysicalFS] SQL> select max(sequence#),thread# from v$archived_log where first_time > to_date('11/02/2017 13:58:39', 'DD-MM-YYYY HH24:MI:SS') group by thread#; MAX(SEQUENCE#) THREAD# -------------- ---------- 30 1 |
The reason for the difference in 2 sequences is that there is 1 more log switch operation until I do my operations.
g. A table belonging to the TEST user is DROPed to see if the DDL and DML operations are running smoothly.
i. Existing tables are queried.
1 2 3 4 5 6 7 8 9 10 11 12 13 14 15 16 17 | [Physical] SQL> select table_name from dba_tables where owner='TEST'; TABLE_NAME -------------------------------------------------------------------------------- DEPARTMENTS_YEDEK REGIONS_YEDEK JOBS_YEDEK EMPLOYEES_YEDEK [Logical] SQL> select table_name from dba_tables where owner='TEST'; TABLE_NAME -------------------------------------------------------------------------------- REGIONS_YEDEK DEPARTMENTS_YEDEK EMPLOYEES_YEDEK JOBS_YEDEK |
ii. A table is DROP.
1 2 3 4 5 6 7 8 9 10 11 12 13 14 15 16 17 18 19 20 | [Physical] SQL> drop table test.DEPARTMENTS_YEDEK; Table dropped. [Physical] SQL> select table_name from dba_tables where owner='TEST'; TABLE_NAME -------------------------------------------------------------------------------- REGIONS_YEDEK JOBS_YEDEK EMPLOYEES_YEDEK [Logical] SQL> select table_name from dba_tables where owner='TEST'; TABLE_NAME -------------------------------------------------------------------------------- REGIONS_YEDEK EMPLOYEES_YEDEK JOBS_YEDEK |
27. Assuming that the problem in the original Primary database has been resolved, let’s re-enable it and ask it to assume the role of Physical Standby. For this, the database is mounted.
1 2 3 4 5 6 7 8 9 | [Primary] SQL> startup mount; ORACLE instance started. Total System Global Area 3472883712 bytes Fixed Size 2930272 bytes Variable Size 822086048 bytes Database Buffers 2634022912 bytes Redo Buffers 13844480 bytes Database mounted. |
28. The logs in the Observer are followed.
1 2 3 4 5 | 14:24:05.01 Saturday, February 11, 2017 Initiating reinstatement for database "primary"... Reinstating database "primary", please wait... Reinstatement of database "primary" succeeded 14:24:20.64 Saturday, February 11, 2017 |
29. The status of the original Primary database is queried.
1 2 3 4 5 | [Primary] SQL> select status from v$instance; STATUS ------------ OPEN |
30. The Recovery Modes of the databases are queried.
1 2 3 4 5 6 7 8 9 10 11 12 13 14 15 16 17 18 | [Primary] SQL> select open_mode, database_role, protection_mode from v$database; OPEN_MODE DATABASE_ROLE PROTECTION_MODE -------------------- ---------------- -------------------- READ ONLY WITH APPLY PHYSICAL STANDBY MAXIMUM AVAILABILITY [Primary] SQL> select recovery_mode from v$archive_dest_status where dest_id <4; RECOVERY_MODE ----------------------- MANAGED REAL TIME APPLY [Logical] SQL> select recovery_mode from v$archive_dest_status where dest_id <4; RECOVERY_MODE ----------------------- LOGICAL REAL TIME APPLY |
31. It is questioned whether there is an error in the broker configuration.
1 2 3 4 5 6 7 8 9 10 11 12 13 14 15 16 17 18 | DGMGRL> show configuration Configuration - DG_Solution Protection Mode: MaxAvailability Members: physical - Primary database physclFS - Far sync instance primary - (*) Physical standby database logical - Logical standby database Members Not Receiving Redo: prmyFS - Far sync instance Fast-Start Failover: ENABLED Configuration Status: SUCCESS (status updated 30 seconds ago) |
32. A table belonging to the TEST user is DROPed to see if the DDL and DML operations are running smoothly.
a. We are querying the existing tables.
1 2 3 4 5 6 7 8 9 10 11 12 13 14 15 16 17 18 19 20 21 22 23 | [Physical] SQL> select table_name from dba_tables where owner='TEST'; TABLE_NAME -------------------------------------------------------------------------------- REGIONS_YEDEK JOBS_YEDEK EMPLOYEES_YEDEK [Primary] SQL> select table_name from dba_tables where owner='TEST'; TABLE_NAME -------------------------------------------------------------------------------- REGIONS_YEDEK JOBS_YEDEK EMPLOYEES_YEDEK [Logical] SQL> select table_name from dba_tables where owner='TEST'; TABLE_NAME -------------------------------------------------------------------------------- REGIONS_YEDEK EMPLOYEES_YEDEK JOBS_YEDEK |
b. A table is DROP.
1 2 3 4 5 6 7 8 9 10 11 12 13 14 15 16 17 18 19 20 21 22 23 24 | [Physical] SQL> drop table test.REGIONS_YEDEK; Table dropped. [Physical] SQL> select table_name from dba_tables where owner='TEST'; TABLE_NAME -------------------------------------------------------------------------------- JOBS_YEDEK EMPLOYEES_YEDEK [Primary] SQL> select table_name from dba_tables where owner='TEST'; TABLE_NAME -------------------------------------------------------------------------------- JOBS_YEDEK EMPLOYEES_YEDEK [Logical] SQL> select table_name from dba_tables where owner='TEST'; TABLE_NAME -------------------------------------------------------------------------------- EMPLOYEES_YEDEK JOBS_YEDEK |
![]()