 Database Tutorials MSSQL, Oracle, PostgreSQL, MySQL, MariaDB, DB2, Sybase, Teradata, Big Data, NOSQL, MongoDB, Couchbase, Cassandra, Windows, Linux
In our article today, we will be discussing how we can monitor SQL Server using open source systems (Influxdb and Grafana).
First of all, let’s get to know our Open-Source products.
InfluxDB
It is an open source database that is prepared with GO with its superior features such as real -time analytical studies, storage of application metrics and analysis of high performance/queries.
Grafana
Grafana is an open source, general-purpose dashboard and graphics program that works as a web application.
I can say that it has become very popular lately because it shows you the data it receives from different data sources as a dashboard.
Our needs;
-One Linux server
-SQL Server Server you will monitor
INFluxdb and Grafana Installation to Linux server
Demo will be using ubuntu 16.04 TLs, I already have a Linux server on the Amazon AWS and we will be doing our installation operations on this server.
Let’s start the installation.
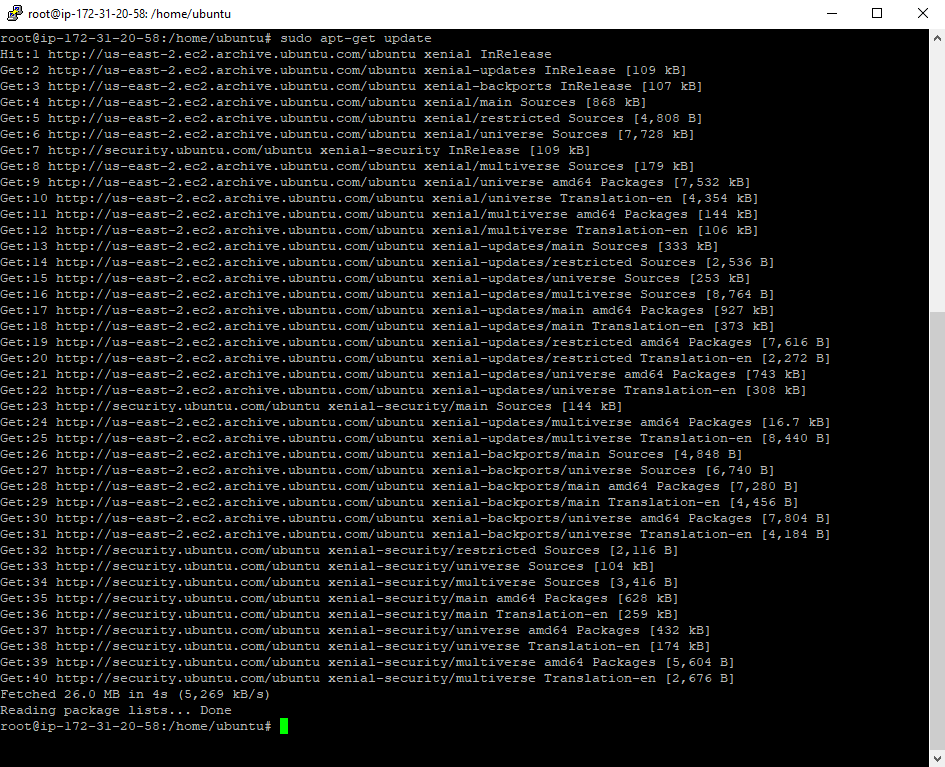
First of all, I run APT-GET Update on my Linux server and apply the current files to my server.
I will be based on the official site of the product.
1 | https://docs.influxdata.com/influxdb/v1.7/introduction/installation/ |
I’m running the following installation commands.
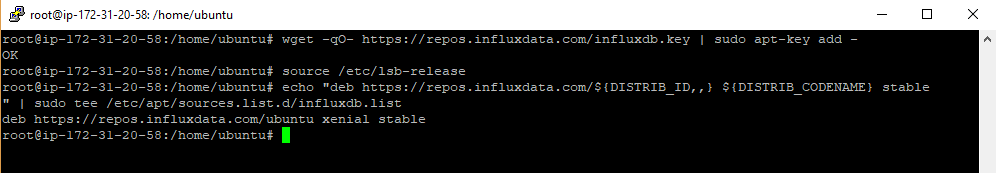
After defining the repository server required for Influxdb as in the picture above, I run the following installation commands.
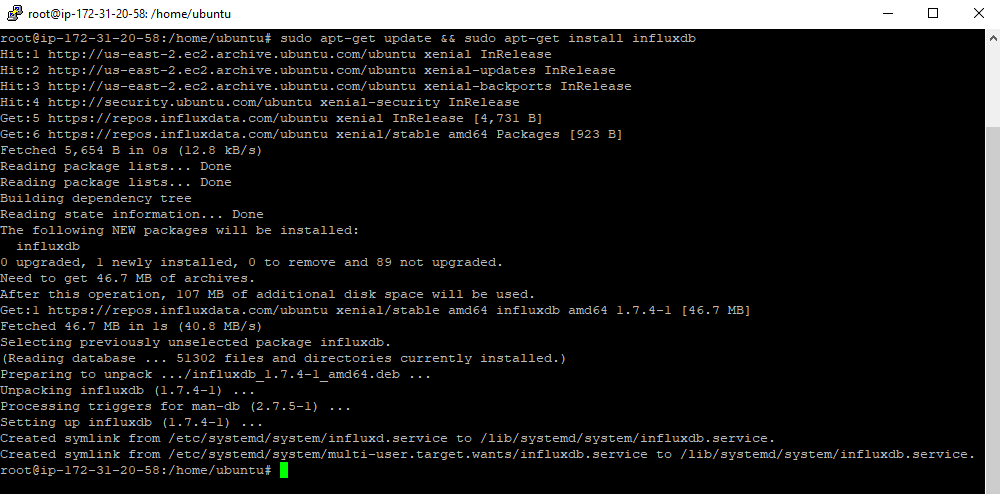
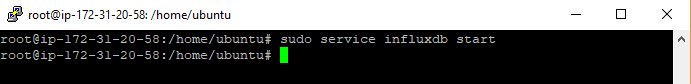
After completing the installation with apt-get install influxdb, I start influxdb. (sudo service influxdb start)
We have completed the installation of Influxdb. I confirm the installation process with systemctl status influxdb.Service.
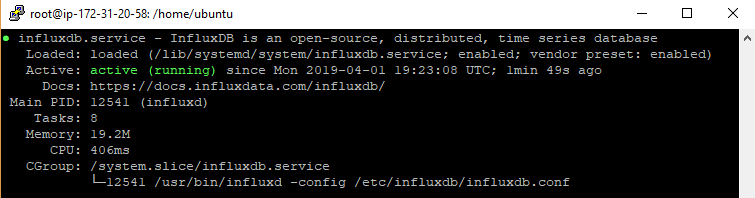
As shown in the picture above, influxdb has successfully realized the installation.
The way to the configuration file is /etc/influxdb/influxdb.Conf.
I will make some changes to this configuration file.
I edit the configuration file using vi.
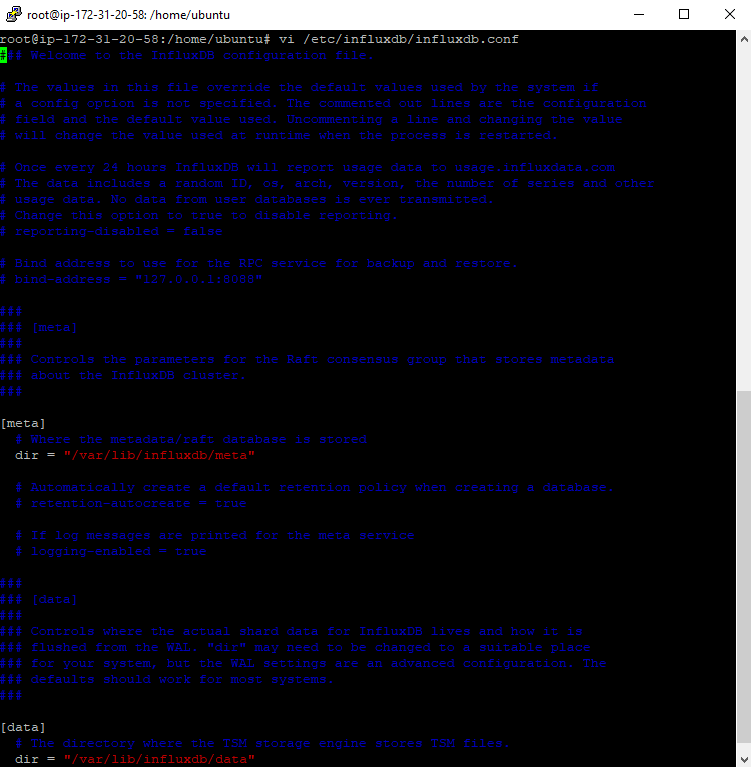
I make the following changes in the configuration file.
[http] Bind-Address = “: 8088”Enabled = True
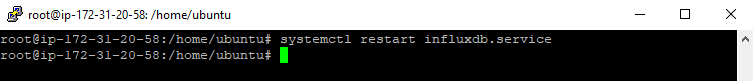
After performing the changes, I save and restart the Systemctl restart influxdb.service.
We have made the necessary adjustments to access Influxdb, now I will create a database and user in Influxdb.
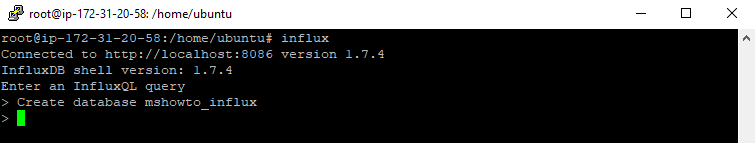
To connect to Influxdb, I just need to write influx.
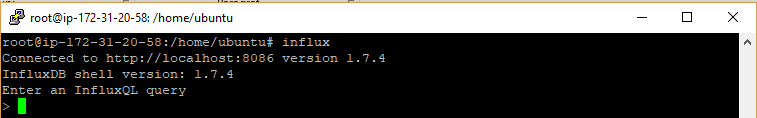
As you can see in the picture, I have reached Influxdb and tells me that I can now use InfluxQL.
With Create Database mshowto_influx, I create a database called mshowto_influx.
With the following command, I create a user called “telegraf” and perform the necessary authorization.
1 2 | CREATE USER telegraf WITH PASSWORD ‘superpa$$word’ GRANT ALL ON mshowto_influx TO telegraf |
I performed the necessary operations on the Influxdb side.
Now I’m going to the Grafana installation I need to visualize the existing data in InfluxDB.
Grafana Installation
I get the official site for the installation of Grafana.
1 | http://docs.grafana.org/installation/debian/ |
With the following commands, I install graphana.
1 2 3 | wget https://dl.grafana.com/oss/release/grafana_5.4.2_amd64.deb sudo apt-get install -y adduser libfontconfig sudo dpkg -i grafana_5.4.2_amd64.deb |
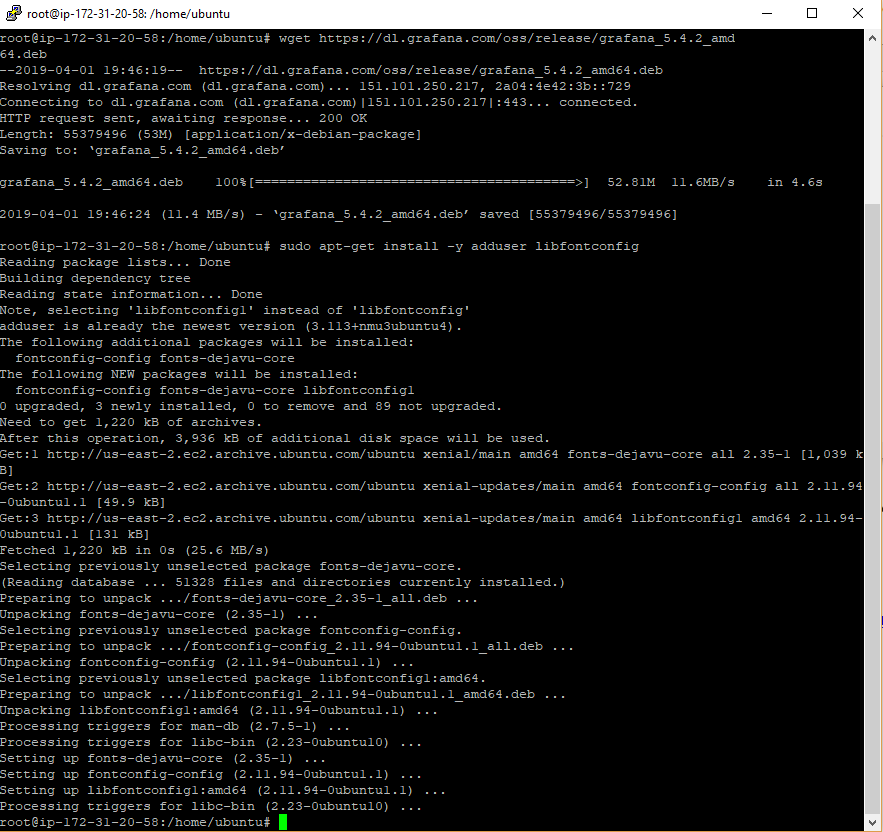
1 2 | sudo apt-get update sudo apt-get install Grafana |
After running the above codes, I verify the Grafana installation with the following command.
1 | Systemctl status Grafana |
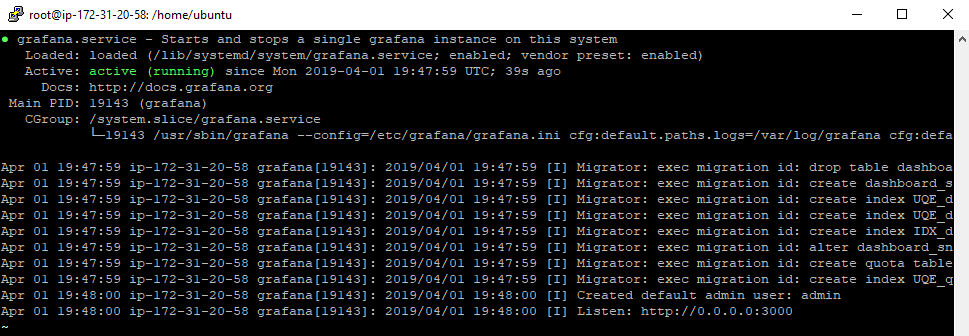
We have completed the Grafana installation and it informs us that a default user named admin has been created.
Now all I have to do is finalize my installation process by allowing the required ports 3000 and 8086 on Amazon AWS for the influxdb and Grafana I installed on the server.
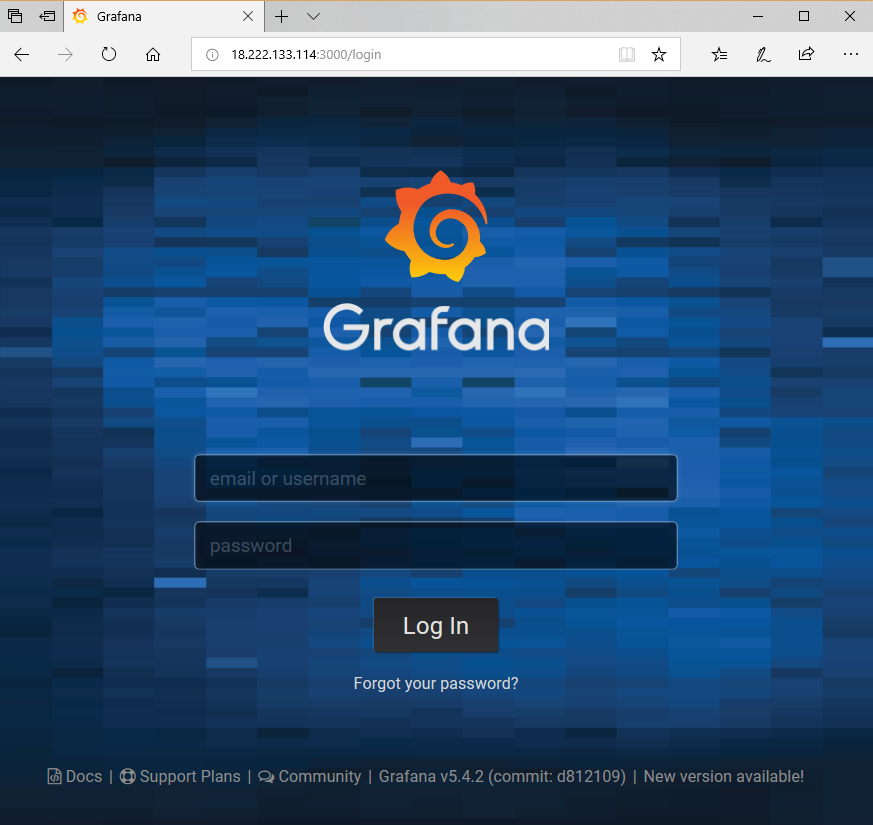
When you encounter a screen like above, you can log in with the user name and admin password.
After this stage, you will ask you to replace the admin user’s password.
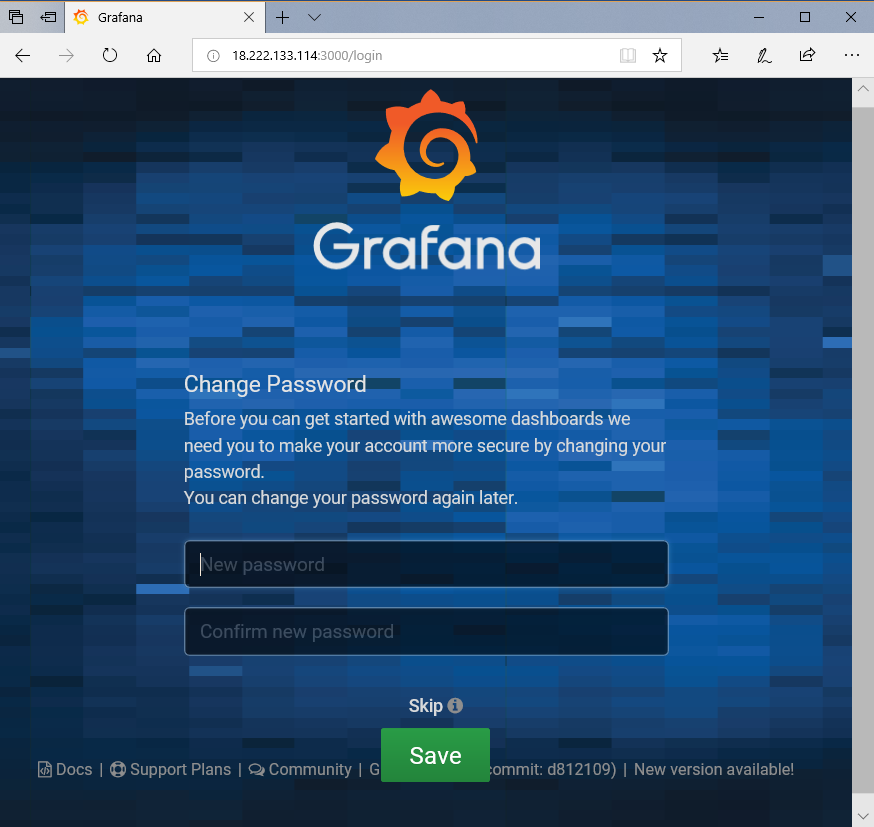
After setting a new strong password, you can continue by clicking save or continue without changing the password with skip.
After accessing Grafana, you need to choose which data source you will use, so we click on add data source and select influxdb.
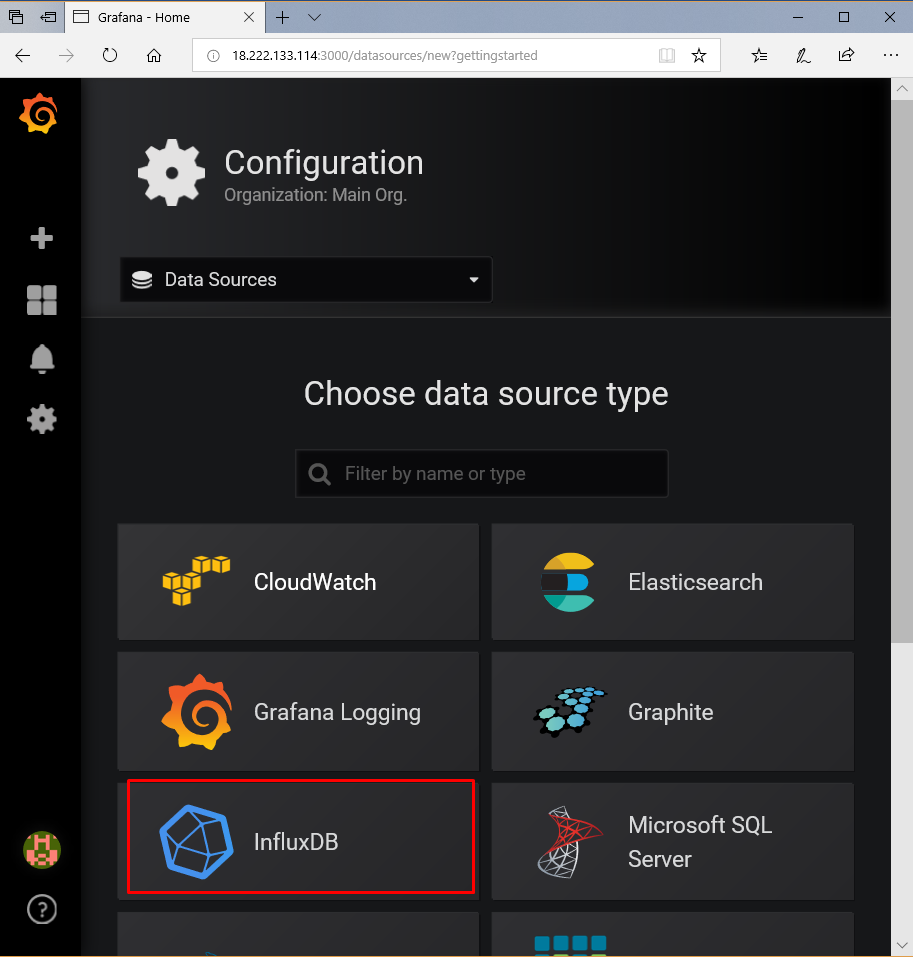
As you can see in the image above, you can choose from many data sources other than InfluxDB.
We choose InfluxDB and continue.
After selecting InfluxDB, it will ask you to enter the necessary configuration settings for the InfluxDB you have installed.
We enter the following values.
URL : http://localhost:8086
database : mshowto_influx
username : telegraf
password : superpa$$word
We enter the information and save it.
After the registration process, we successfully complete our data source addition process.

After performing all these operations on our Linux server, we will make the necessary adjustments to monitor SQL Server with Telegraf.
For Telegraf, you can use the telegraf.exe and telegraf.conf file that I will share in the attachment.
Configuration of the “Telegraf.conf” file
You should open the telegraf.conf file I shared attached with a text editor and enter the SQL Server information you want to follow.
However, for this process, you must first create a user named telegraf on SQL Server with the code block below and provide the necessary authorization.
1 2 3 4 5 6 7 8 | USE master; GO CREATE LOGIN [telegrafuser] WITH PASSWORD = N’superpa$$word’; GO GRANT VIEW SERVER STATE TO [telegrafuser]; GO GRANT VIEW ANY DEFINITION TO [telegrafuser]; GO |
After defining the user, we need to enter the access information for InfluxDB in the OUTPUT PLUGINS section in the telegraf.conf file.
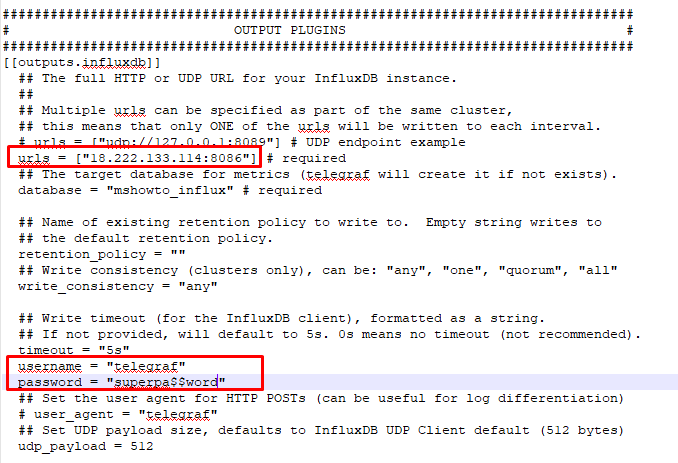
After making the InfluxDB settings as shown in the example, you must enter your SQL Server access information that you want to monitor in the INPUT PLUGINS section.
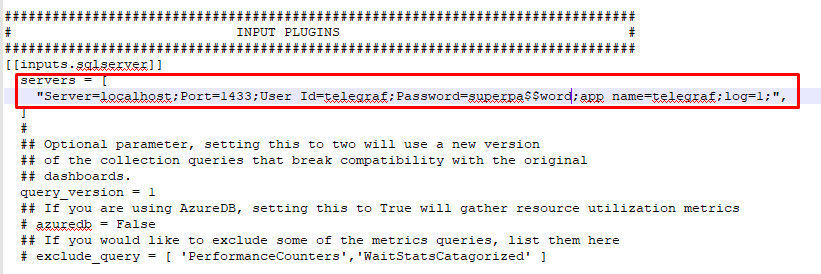
In the Servers section, you can enter the server information you want to access more than once.
After entering this information, you need to run telegraf.exe as a Windows service with the configuration file you prepared.
To do this, you can run Powershell or the command line as an administrator and use the code block below. (I assume that the file directory I shared in the attachment is under the Program Files folder.)
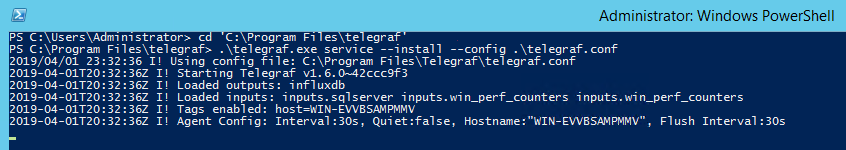
As you can see above, our data collection process via telegraph has started to work successfully.
Now all we have to do is configure the dashboard via Grafana.
I usually use one of Grafana’s ready-made dashboards for this. (https://grafana.com/dashboards/409)
To load the ready dashboard, I apply draft number 409 from the Import menu on Grafana.
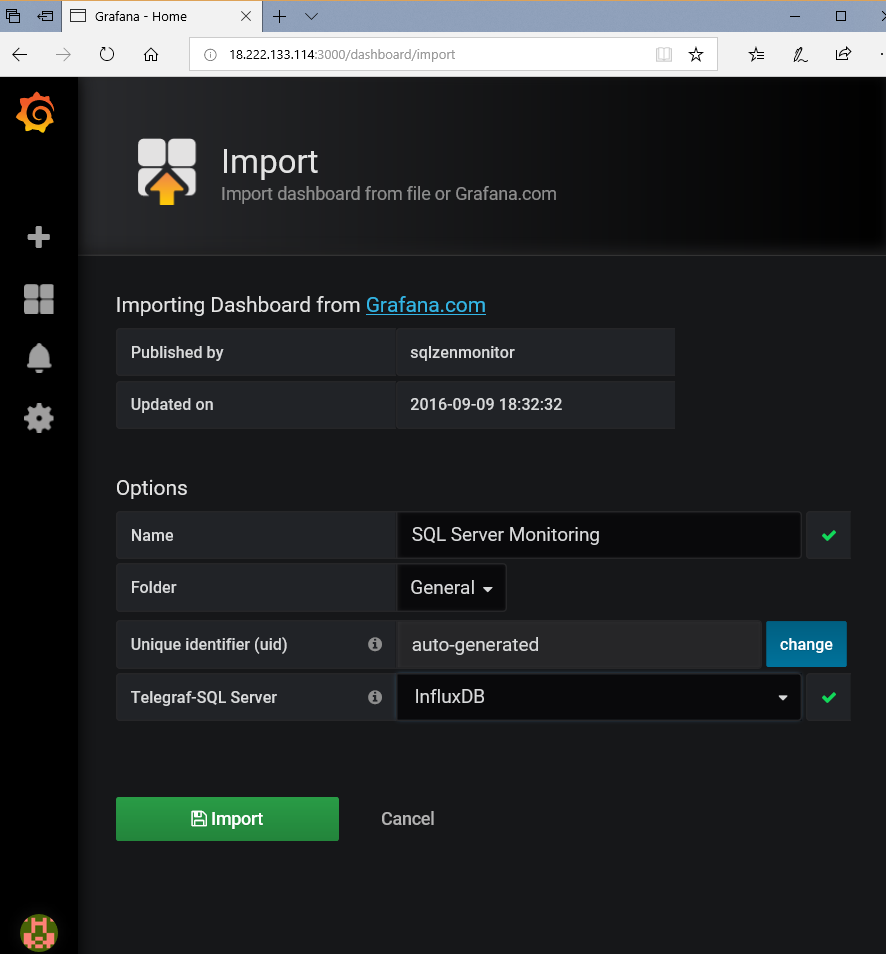
It asks me to choose a data source for the Dashboard.
I select InfluxDB and import it.
After the import process, I can monitor my SQL Server server with the screen as below.
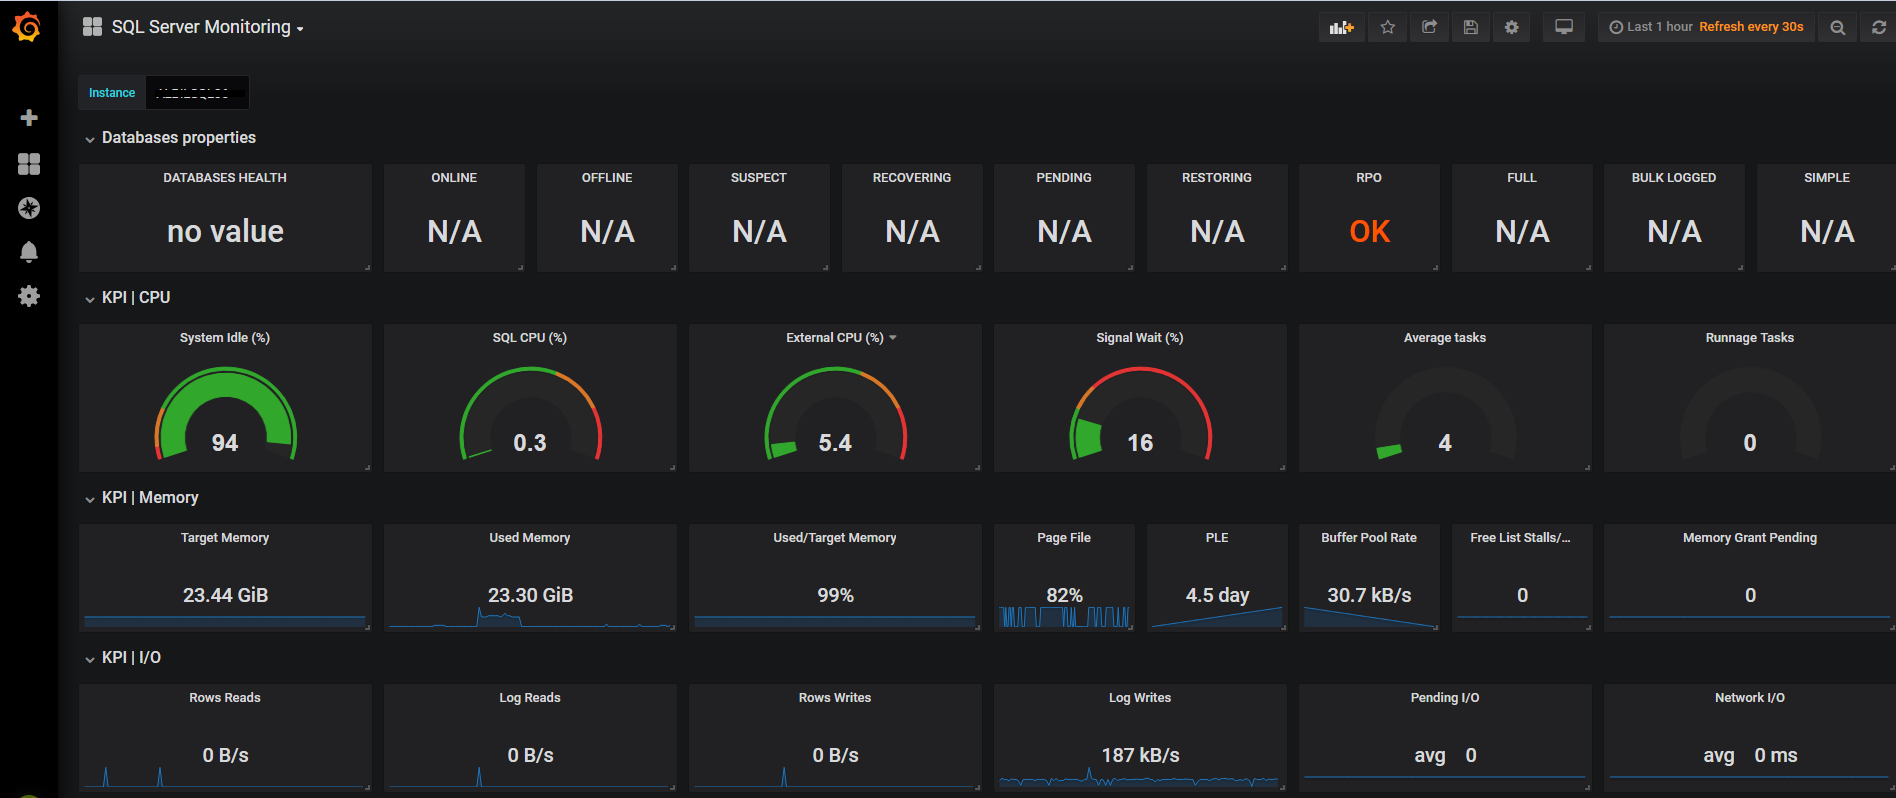
![]()