 Database Tutorials MSSQL, Oracle, PostgreSQL, MySQL, MariaDB, DB2, Sybase, Teradata, Big Data, NOSQL, MongoDB, Couchbase, Cassandra, Windows, Linux
When there is an error in the database, the first place to look at is SQL Server Error Log. Sometimes there is no problem with the database, but the application still gives an error. Application developers cannot find the cause of the error. In such a case, they may ask you for help.
For example, they may not be able to add records to the database. In such a case, you should ask to the application developer the relevant login name. You can then monitor the errors received with this login using SQL Server Extended Events.
Example:
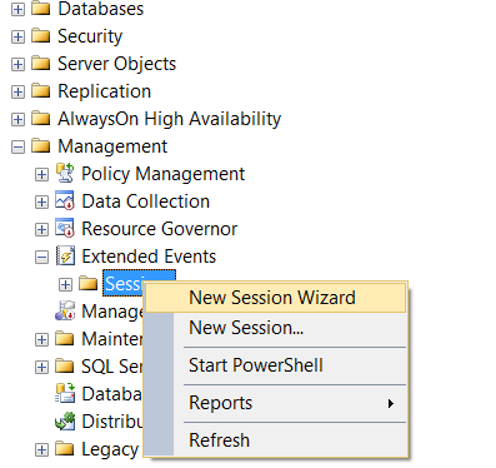
Suppose we have a login called TestLogin. We use the Management-> Extended Events tabs on SSMS (SQL Server Management Studio) to create a new Extended Event Session as follows.
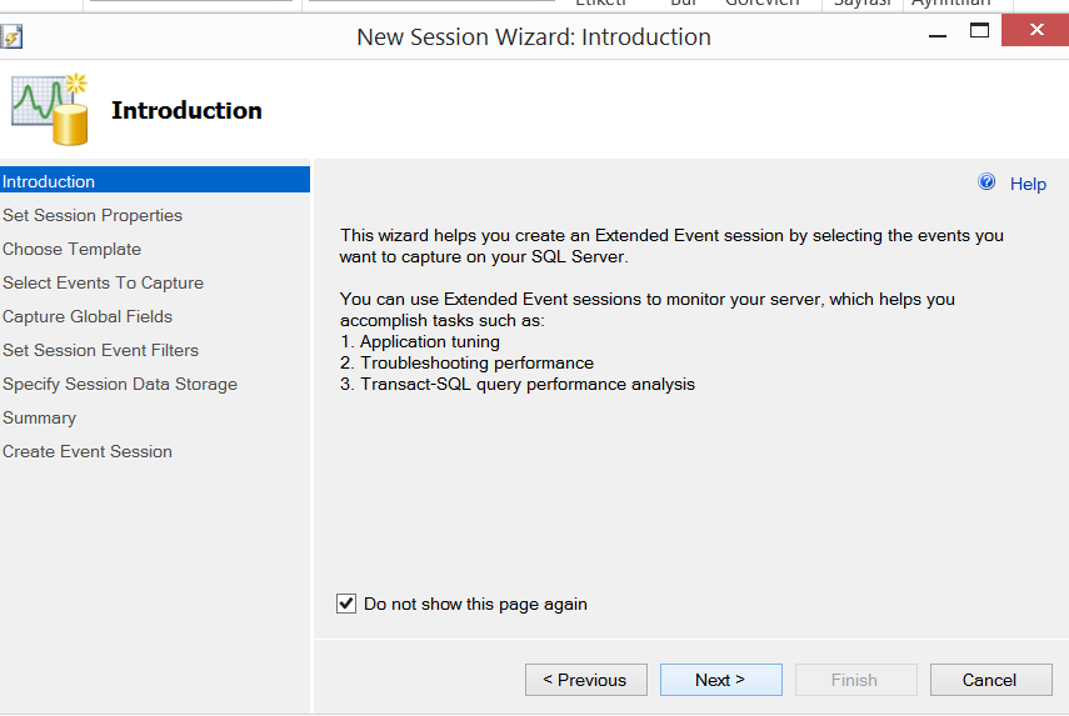
On the next screen, select “Do not show this page again” and click next.
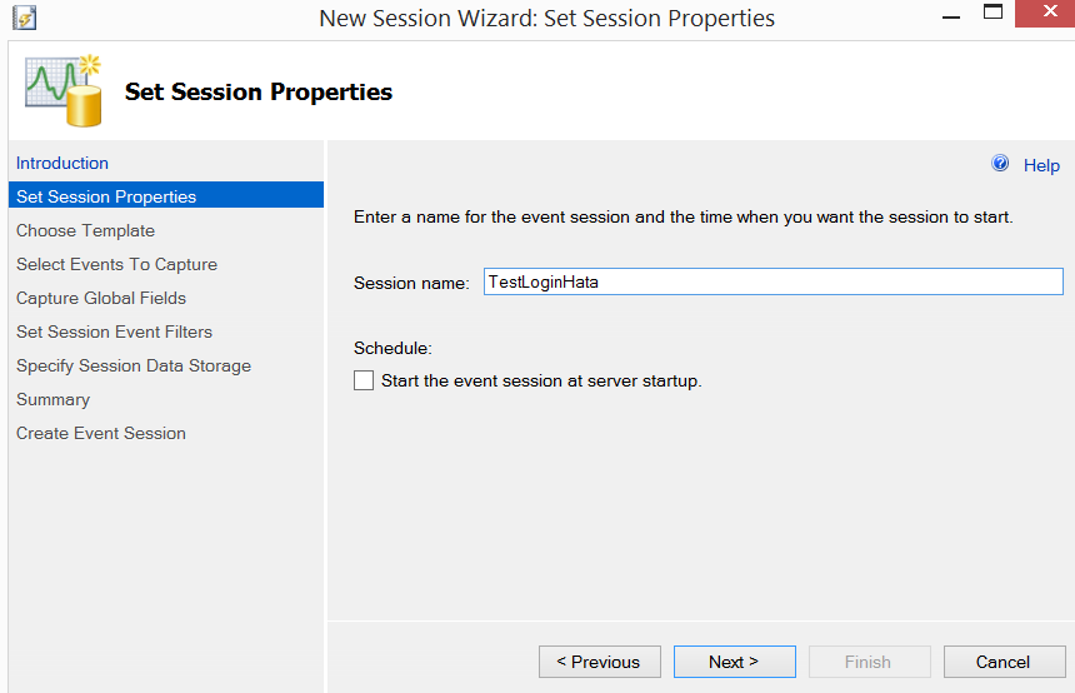
On the next screen, we give a name to the Extended Event Session in the Session name section. By clicking “Start the event session at server startup”, you can set this session to open automatically when the server is opened. I don’t choose this option because I usually open this session in case of error.
The next screen asks if we want to use an existing template to create the session. I won’t use any templates for this process. So I choose “Do not use a template” and click next. If you’re interested in other articles about Extended Events, you should type Extended Events in the Search section of our site.

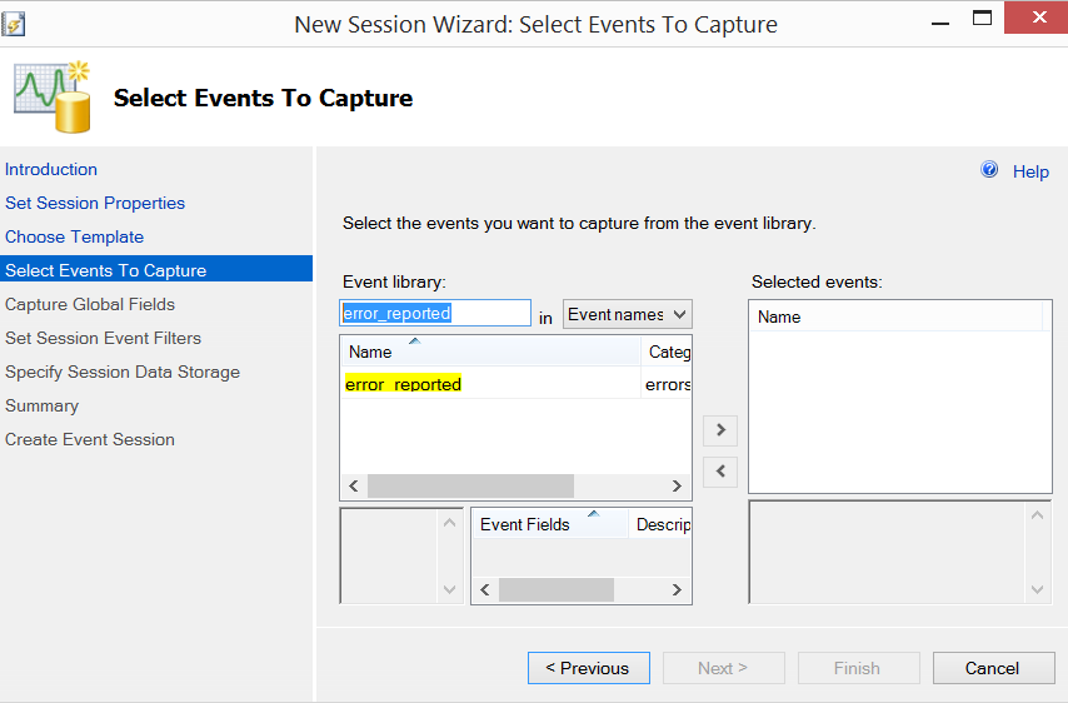
On the next screen, we write error_reported to the bottom of Event Library, and double click on the error_reported in the following image and click next.
The next screen asks the parameters we want to capture about the error. I am doing the following selections for this process.
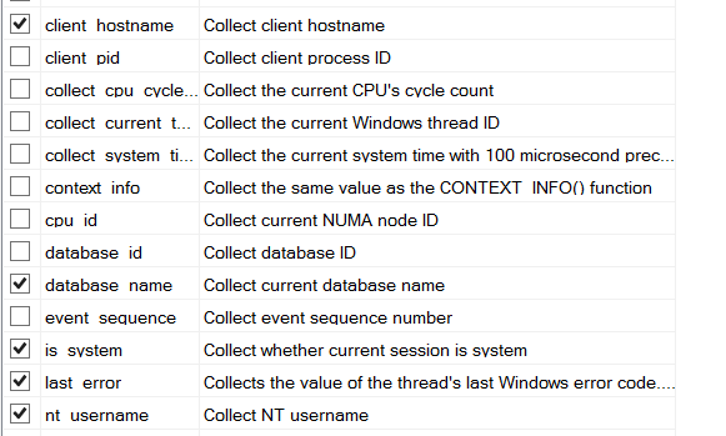
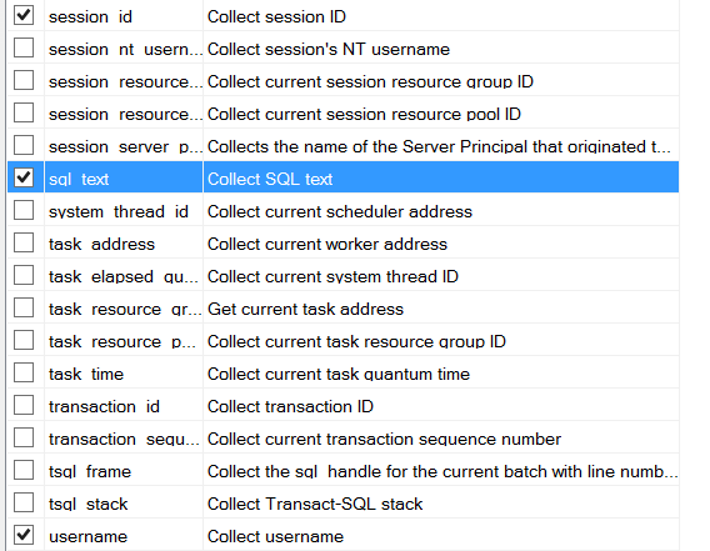
The most important ones for me are the sql_text and username parameters.
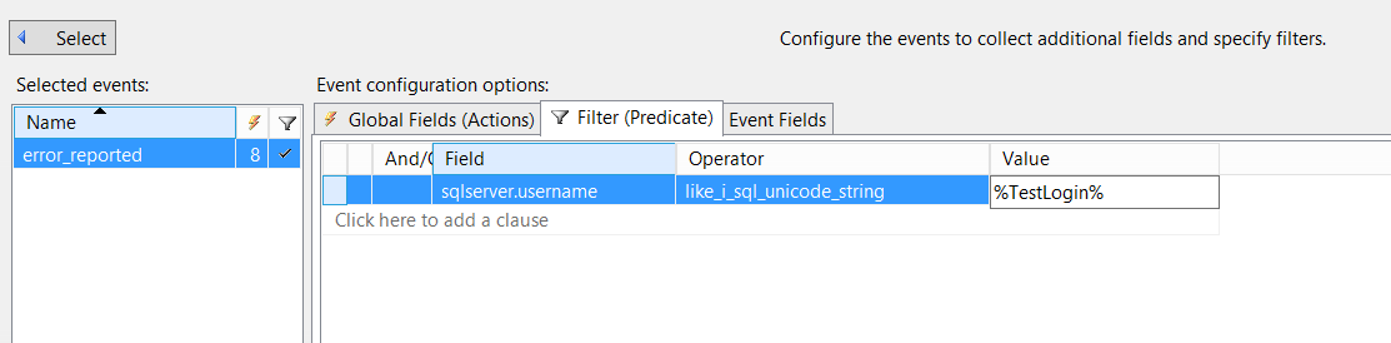
We will perform filtering on the next screen. If we don’t filter, we’ll be tracking any errors on this instance.
By filtering as follows, we will only capture the errors about TestLogin.
Click Next and Finish to complete the installation. After the installation is complete, we start the session as below.
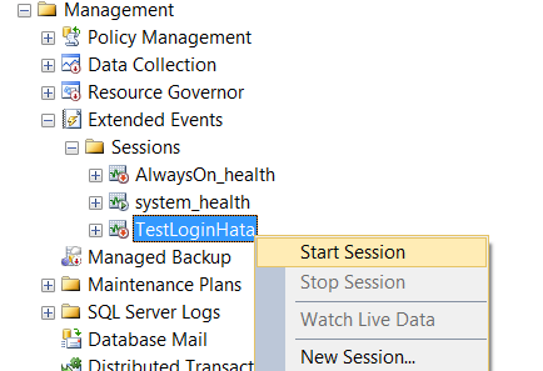
I recommend that you keep the session off when you are not using it. After the start process, right click on the session and click on “Watch Live Data” as below to open the below screen.
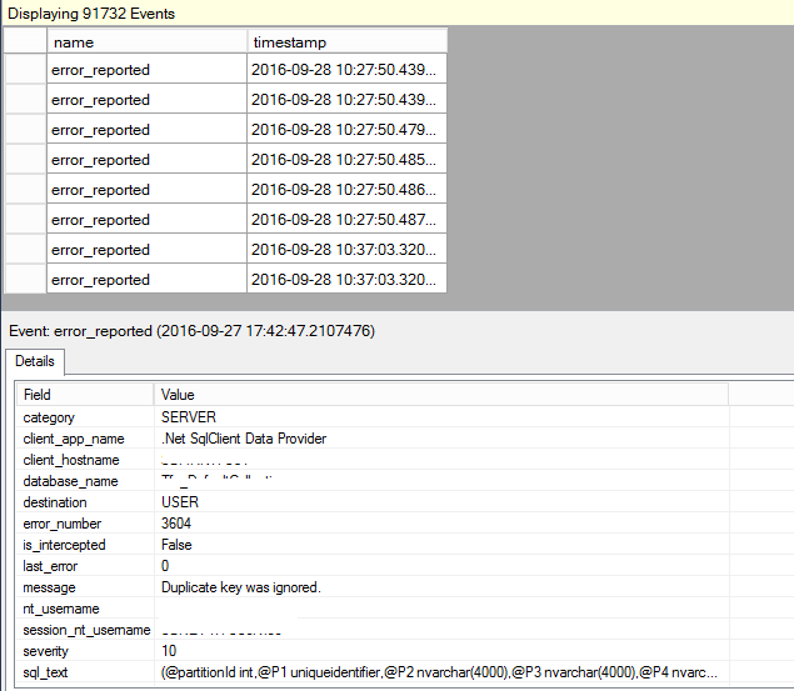
For example, we can interpret the error shown in the above screen as follows.
The query that is written in the sql_text section is the query that is sent by TestLogin and that receives the error.
In the message section, there is information about why the query is getting this error. You can inform the application developer in this way.
![]()