 Database Tutorials MSSQL, Oracle, PostgreSQL, MySQL, MariaDB, DB2, Sybase, Teradata, Big Data, NOSQL, MongoDB, Couchbase, Cassandra, Windows, Linux
Application developers sometimes receive a deadlock error and cannot see which queries are deadlocked. That’s why they demand this information from you. We can capture deadlocks using Extended Events or SQL Server Profiler.
You can find detailed information about DeadLock in the article “What is DeadLock in SQL Server“.
Let’s capture DeadLocks using Extended Event:
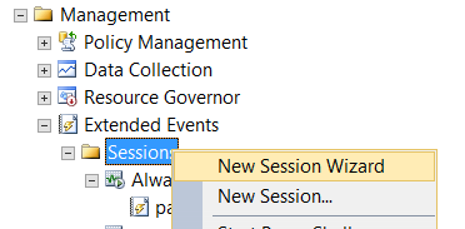
On SSMS, right-click on the Session under Managements-> Extended Events and click on the New Session Wizard.
On the next screen, select “Do not show this page again” and click next.
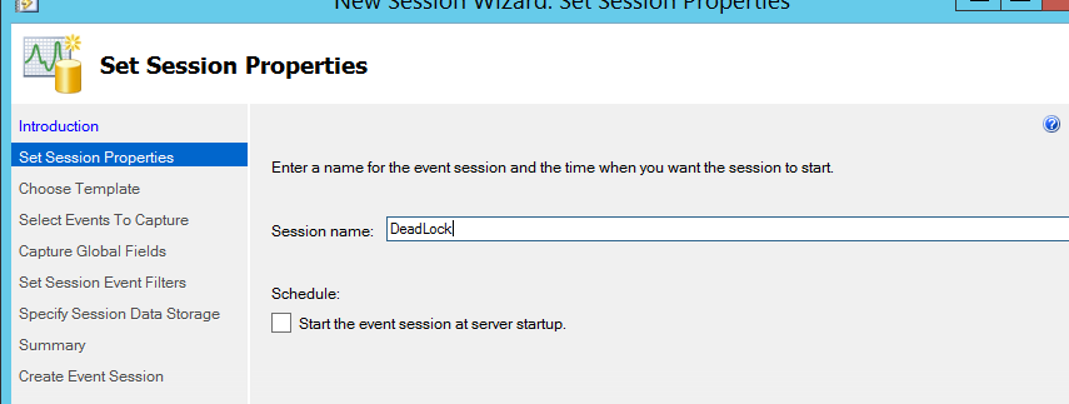
On the next screen, we write DeadLock to Session name. I do not select “Start the event session at server startup”. Because I don’t want this session to start automatically when the server starts.
On the next screen, select “Do not use template” and click next.
On the next screen I write deadlock to the Event Library as shown below and the events related to the deadlock are listed immediately below.
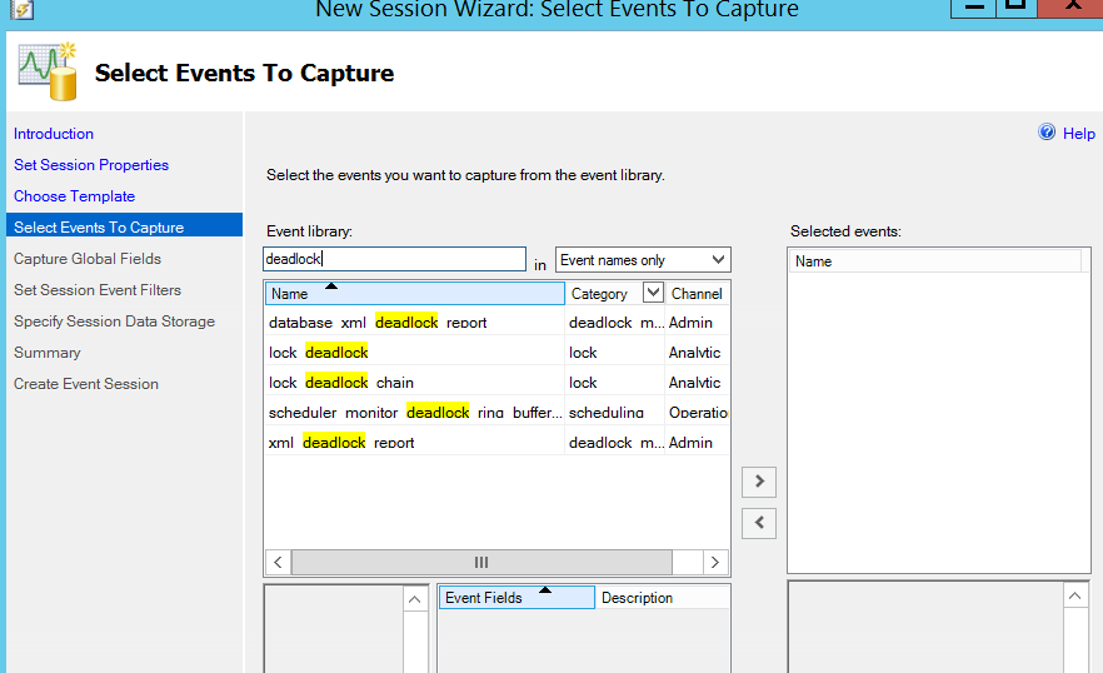
I double click to select “xml deadlock report”. Thus, we can see deadlocks graphically. Click next.
On the next screen, I select the following options.
- Client hostname
- Client app name
- Database name
- Sql text
- User name
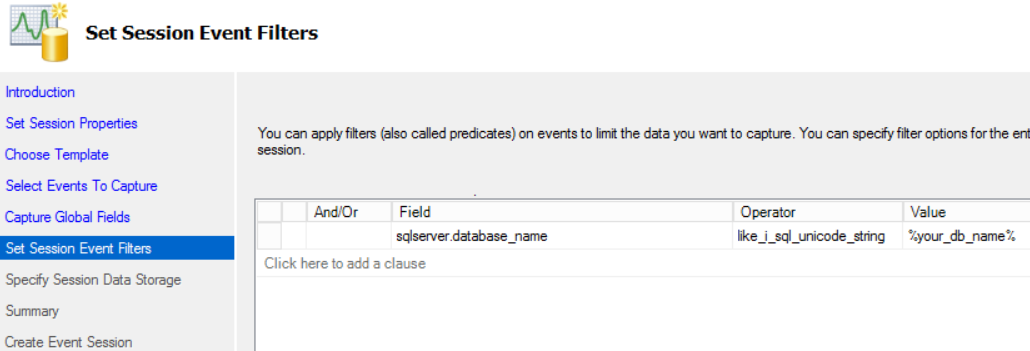
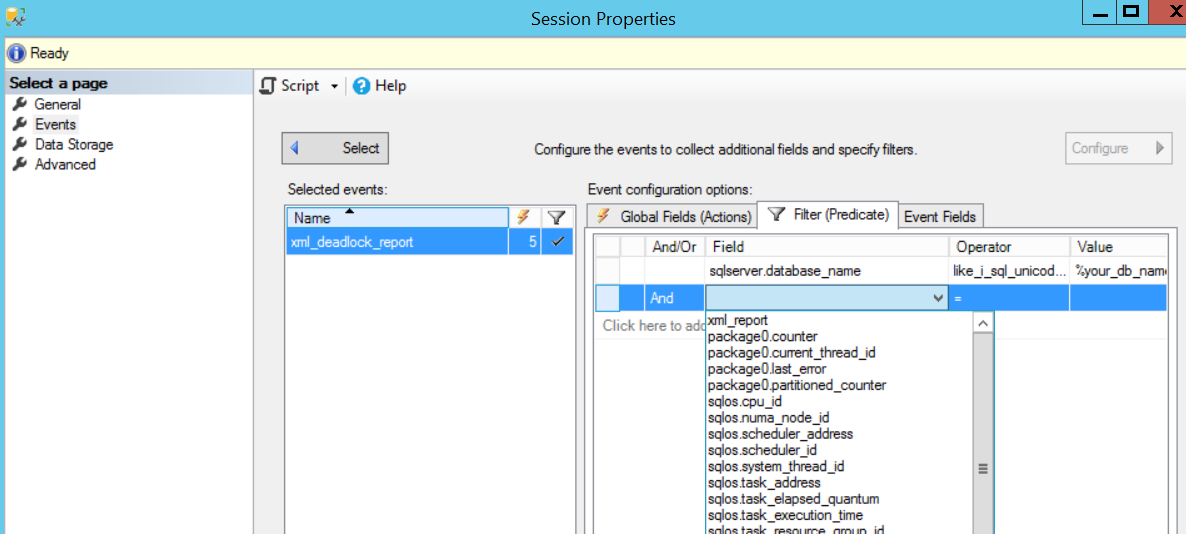
On the next screen you can put the filter as below.
Or you can filter by the following way after you create Extended Event Session.
Right-click on Session and click Properties. Then add filters by clicking Configure on Events.
If you want to create a filter after you create the Extended Events Session, you must set a separate filter for each of the selected events.
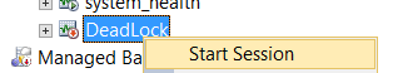
On the following screens, click next next and finish to complete the process and start the session as follows.
When we click “watch live data” on the Session, a screen like below will appear.
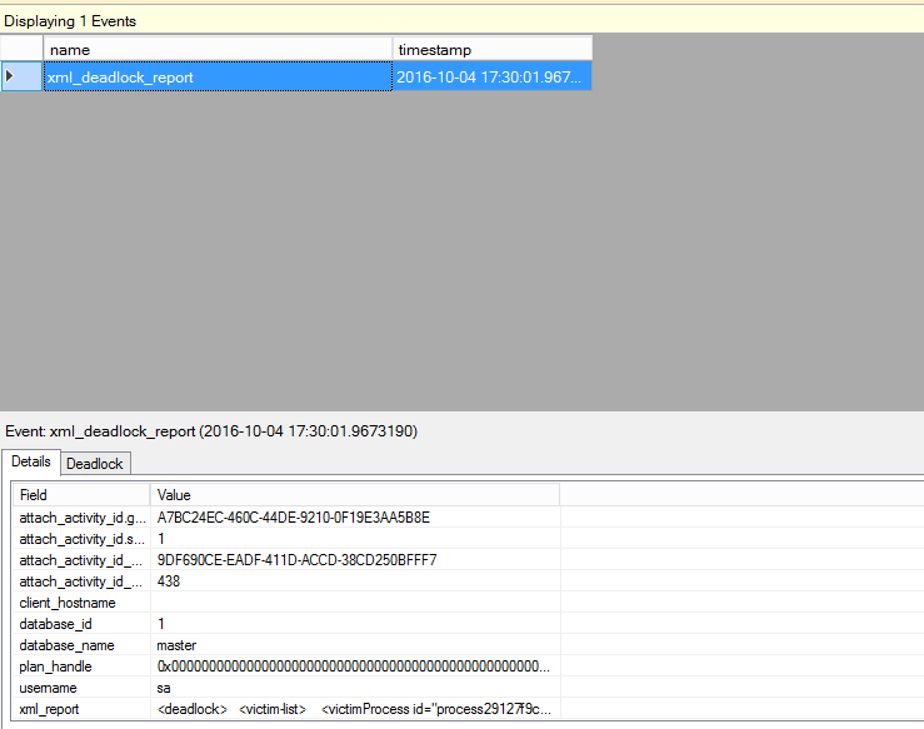
By double-clicking on xml_report in the Details section, we can see which queries are deadlocked. The process in the victim-list is the process selected as the victim.
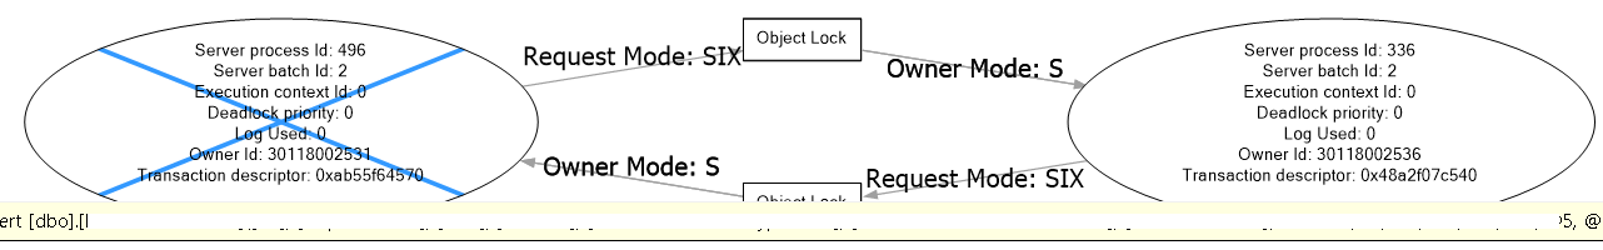
In the DeadLock section, we will see a screen like below. The transaction with the X mark is the transaction selected as the victim. The other is the transaction that continues.
When you move the mouse over the circled transactions, the corresponding query will appear.
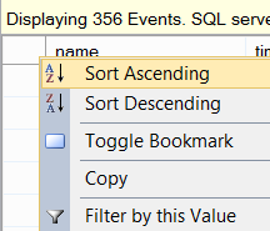
If you want to filter in the result set, you can do this by right-clicking in the upper-left corner by clicking “Filter by this Value”.
![]()