 Database Tutorials MSSQL, Oracle, PostgreSQL, MySQL, MariaDB, DB2, Sybase, Teradata, Big Data, NOSQL, MongoDB, Couchbase, Cassandra, Windows, Linux
In PostgreSQL, you may need to review more than one thing to analyze database or whole cluster when you encounter a problem.
For example, a performance problem has occurred. We may examine indexes, I/O, CPU etc.
We need to write different queries and review them one by one. Instead of doing these operations, we can use the pg_profile extension, which collects them all together and outputs them in HTML format.
The pg_profile extension is based on the standard statistical views of PostgreSQL. It is similar to Oracle AWR architecture. Like Oracle, it takes snapshot at specified times and it gives you html format to interpret the statistical data between snapshots.
Configure postgresql.conf
Before starting the installation, we need to make some configurations in postgresql.conf.
To collect statistics, we need to modify the following parameters via postgresql.conf.
1 2 3 4 | track_activities = on track_counts = on track_io_timing = on track_functions = on |
After the above steps are done, we are changing the pg_stat_statements parameters.
1 2 3 4 | shared_preload_libraries = 'pg_stat_statements' pg_stat_statements.max = 1000 pg_stat_statements.track = 'top' pg_stat_statements.save = off |
Download and Install pg_profile
First, we need to download the pg_profile extension from github.
https://github.com/zubkov-andrei/pg_profile
After downloading the file to the server, go the directory you downloaded and follow the steps below.
We’re running the Make command.
1 | make install |
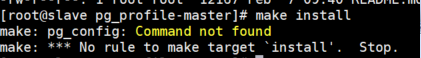
If you receive the below error while running this command, you can run this command at the end of the path parameter as follows.
1 | PATH=/usr/pgsql-10/bin:$PATH make install |
CREATE EXTENSION
If we run Make install and make the necessary configurations, we can connect to the Postgresql by using psql client to create extensions as follows.
1 2 3 | CREATE EXTENSION dblink; CREATE EXTENSION pg_stat_statements; CREATE SCHEMA profile; |
Some objects will be created when we create the pg_profile extension. In order to create these objects in the schema we just created, we specify the schema as below when creating the extension.
1 | CREATE EXTENSION pg_profile SCHEMA profile; |
You can use the following command to update the Extension.
1 | alter extension pg_profile update; |
Create Crontab Job To Take Snapshot at Specified Intervals
I mentioned that pg_profile takes snapshot at specified times and interprets the statistical data between these snapshots and produces html outputs. Therefore, we need to add the snapshot functions to the crontab as follows. I’ve arranged to get a snapshot in half an hour. But you can do it for a shorter period. We open the crontab by using the command “crontab -e”, and add the following commands.
1 2 3 | */30 * * * * psql -c 'SELECT profile.snapshot()' > /var/log 2>&1 */30 * * * * psql -c 'SELECT snapshot()' > /var/log 2>&1 |
In the command above I specified that the logs will be written in the var/ log directory. You can change it if you want. With the help of the command below, you can get snapshot before the specified time.
1 | psql -c 'SELECT profile.snapshot()' |
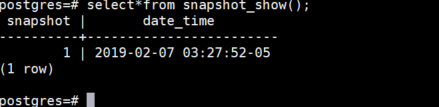
You can view snapshots with the help of the following command.
1 | select * from snapshot_show(); |
We can list snapshots taken with the help of the following command.
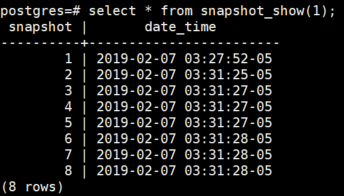
Create a HTML Output
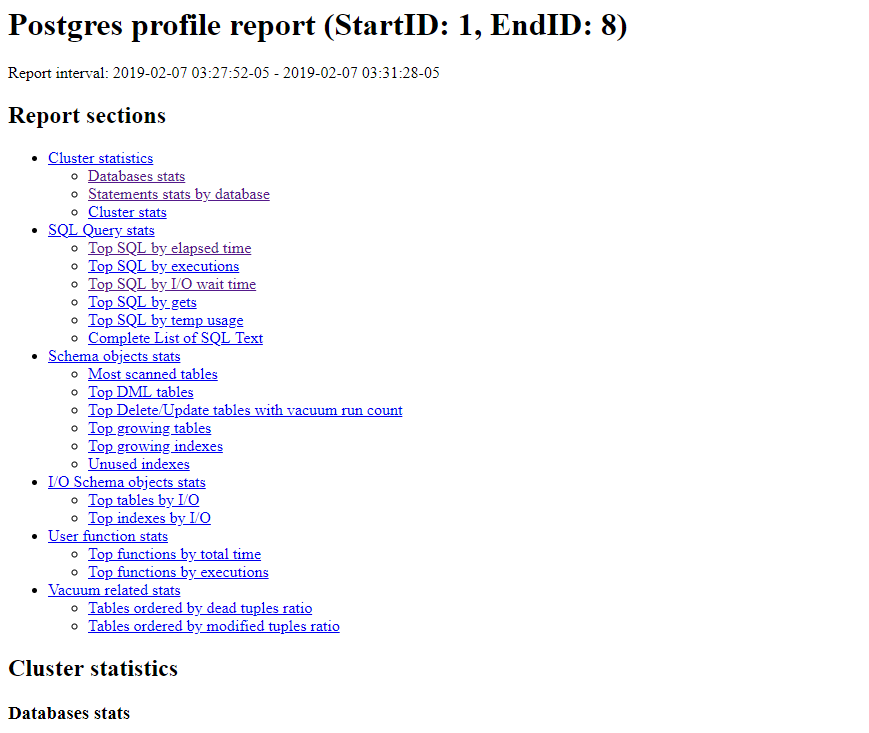
We can use the following command to create a html output. You can specify a path to create the html output in. If you do not specify a path, it creates in the directory you are in.
1 | psql -qtc "SELECT profile.report(1,8)" --output awr_report_postgres_1_8.html |
The output of the above script will be as follows.
![]()
Hello,
in the past i had to do with Oracle AWR. It seens that your extension could be a good solution for PG. I have installed this and after that i got this error:
postgres PSQL> select profile.snapshot();
snapshot
—————————–
FAILED nodes identifiers: 1
Have PG with replication across two Nodes. What will this error say and how can i fix this?
Kind regards
When i am trying to execute
select * from snapshot_show();
I am getting error:
SQL Error [42883]: ERROR: function snapshot_show() does not exist
Hint: No function matches the given name and argument types. You might need to add explicit type casts.
Position: 15
SQL Error [42883]: ERROR: function snapshot_show() does not exist
Hint: No function matches the given name and argument types. You might need to add explicit type casts.
Shall we also do the cleanup of old snaps? Please provide the command