 Database Tutorials MSSQL, Oracle, PostgreSQL, MySQL, MariaDB, DB2, Sybase, Teradata, Big Data, NOSQL, MongoDB, Couchbase, Cassandra, Windows, Linux
The Query Store is a feature that introduced in SQL Server 2016. In order to understand the Query Store, it is necessary to understand the query plan (execution plan). In the article “What is Execution Plan On SQL Server” you can find detailed information about the execution plan.
With Query Store feature, we can better comprehend execution plan selection and its impact on performance.
What is Stored in Query Store?
Query Store stores the history of queries, query plans, and runtime statistics. Thus, we can easily identify the problems caused by the change of the query plan.
The query plan for a query changes over time for many reasons. In some cases, this change causes the query to run slowly. Before the Query Store, it was hard to find whether the query started working slowly because of query plan change. With Query Store, this process has become very simple.
There are multiple query plans for a query in the Query Store. And with plan forcing, a specific query plan can be used. With the help of Plan forcing, the performance problems caused by the change of the query plan can be solved in a short time.
In Query Store, the query’s CPU consumption, read and write information is also stored.
We could see the wait types in SQL Server at the instance level. With SQL Server 2017, we can see wait types from the Query Store.
With the help of the new dmw in SQL Server 2017, we can see wait types of queries and query plans.
1 | select * from sys.query_store_wait_stats |
Find Wait Types of a Specific Query Plan
We can find out wait types of a specific query plan with the help of the following query.
1 2 3 4 5 | select wait_category_desc AS 'Bekleme Türü', sum(total_query_wait_time_ms) AS 'SorguToplamBeklemeSüresi_sn' from sys.query_store_wait_stats where plan_id = 9 group by wait_category_desc |
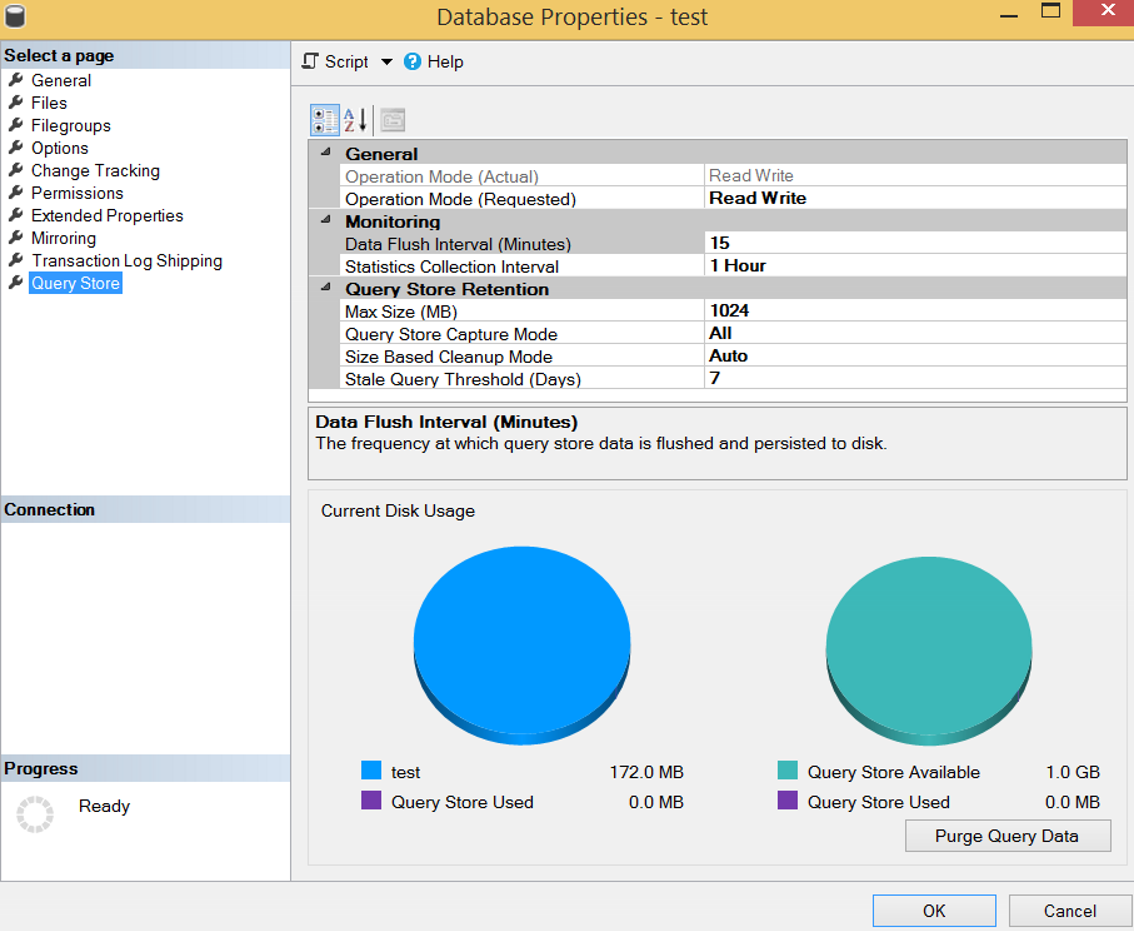
We can enable Query Store at the database level. Right click on the database and click Properties and go to the Query Store tab.
Operation Mode
We select Read Write from Operation Mode. This allows the Query Store to collect the required information.
Data Flush
The value in the Data Flush section also indicates how often the collected data is written to the disk. Since writing to the disk is asynchronous, it does not cause a serious performance problem.
Statistics Collection Interval
Statistics Collection Interval is 1 Hour by default. The Query Store splits the time according to the setting we specify in statistics collection interval and stores the statistics in this range for each execution plan in the Query Store. Setting the Statistics Collection Interval to a lower value will help you solve the problem. But this will increase the size of the Query Store. You can leave it with the default settings and change if needed later.
Max Size (MB)
In Max Size (MB), we set the maximum size that the Query Store can reach in MB. When this value is exceeded, the Operation Mode will automatically change to Read Only.
Query Store The Capture Mode
Query Store The Capture Mode section determines which queries the query store will capture.
Default is All. So it is enable for all queries.
If you select Auto, it doesn’t catch queries that are not frequent.
If you select None, it will not catch any queries.
Size Based Cleanup Mode
In the Size Based Cleanup Mode section, we determine whether automatic data cleaning will run automatically when the max size limit is reached. Default is Auto and Microsoft recommends that you do not change it.
Stale Query Threshold
In the Stale Query Threshold section, we specify how long the information stored in the query store should no longer be stored. Default is 30 days. You can set this time according to your needs. I would not advise you to store it unnecessarily. I think a week will be enough for this setting.
Once the query store has been created, you can select what you want to investigate by right-clicking the query store as follows.
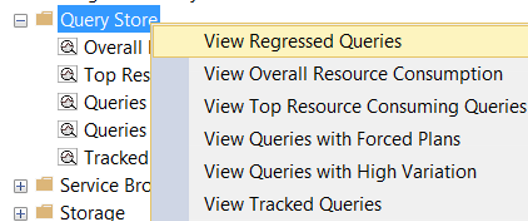
For example, you can capture the most costly queries, and then select the query plan that best works from the graph on the right.
Or, you can identify slow running queries because of the change of execution plan from the Regressed Queries and force them to work with the correct execution plan.
Let’s make an example to understand the topic.
Example
We are creating a table as follows.
1 2 3 4 5 6 7 8 9 10 | CREATE TABLE [dbo].[City]( [ID] [bigint] IDENTITY(1,1) NOT NULL, [CityName] [varchar](250) NULL, CONSTRAINT [PK_City] PRIMARY KEY CLUSTERED ( [ID] ASC )WITH (PAD_INDEX = OFF, STATISTICS_NORECOMPUTE = OFF, IGNORE_DUP_KEY = OFF, ALLOW_ROW_LOCKS = ON, ALLOW_PAGE_LOCKS = ON) ON [PRIMARY] ) ON [PRIMARY] GO |
Then add some records to this table with the following script.
1 | INSERT INTO [dbo].[City]([CityName]) VALUES ('Newyork'),('London'),('Istanbul'),('Ankara'),('Paris') |
We are creating a stored procedure that reads data from this table.
1 2 3 4 5 6 7 8 | CREATE PROCEDURE QueryStoreExample @CityName varchar(200) AS BEGIN select * FROM [dbo].[City] WHERE CityName=@CityName END GO |
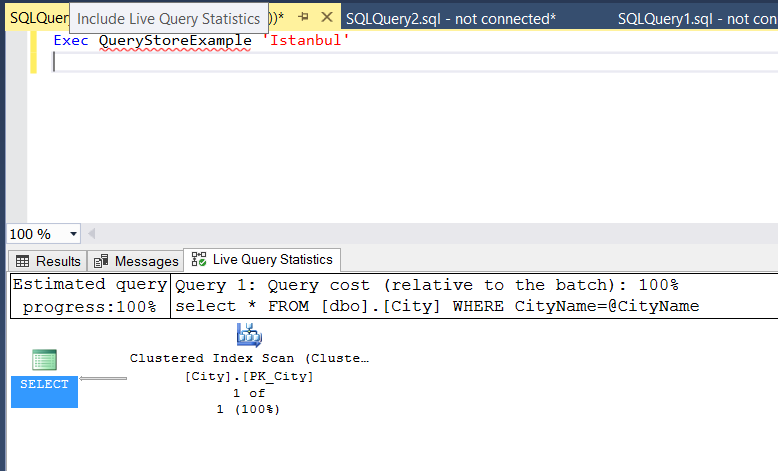
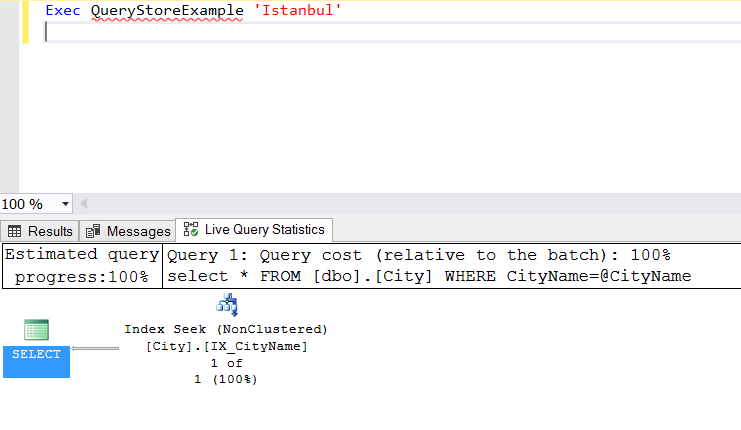
Let’s run this stored procedure as follows and look at the query plan.
1 | Exec QueryStoreExample 'Istanbul' |
As you can see, since there is no index in the table, Clustered Index Scan is performed.
Now let’s create an index in the CityName column as follows and look at the query plan again.
1 2 3 4 5 | CREATE NONCLUSTERED INDEX [IX_CityName] ON [dbo].[City] ( [CityName] ASC )WITH (PAD_INDEX = OFF, STATISTICS_NORECOMPUTE = OFF, SORT_IN_TEMPDB = OFF, DROP_EXISTING = OFF, ONLINE = OFF, ALLOW_ROW_LOCKS = ON, ALLOW_PAGE_LOCKS = ON) |
Now you will see index seek.
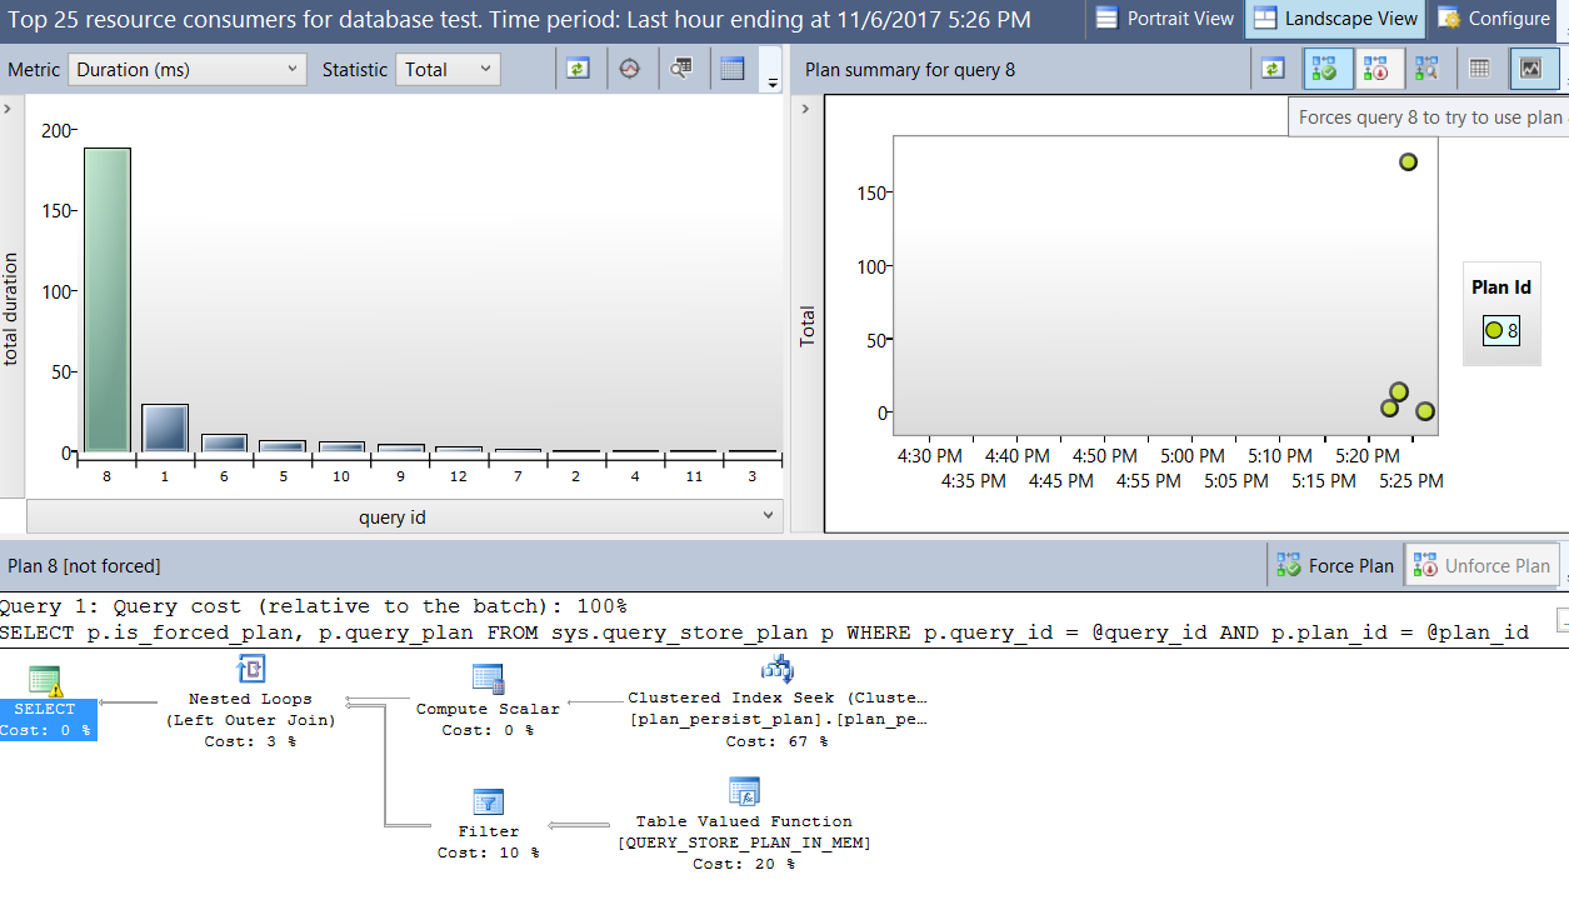
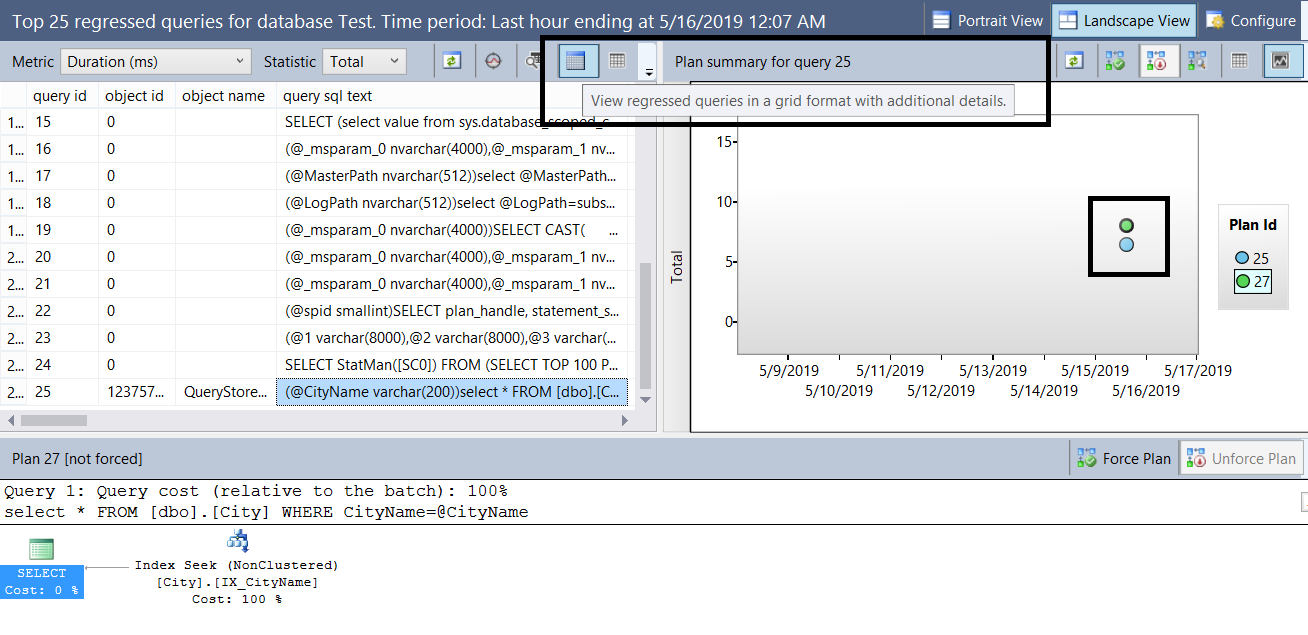
Now delete the index and right click on the query store and click on view reggressed queries.
A screen will appear. You can work more easily by clicking the “View regressed queries in a grid format with additional details” box.
Find the query and look at the query plans on the right.
Two round shapes appear. These query plans saved for this query.
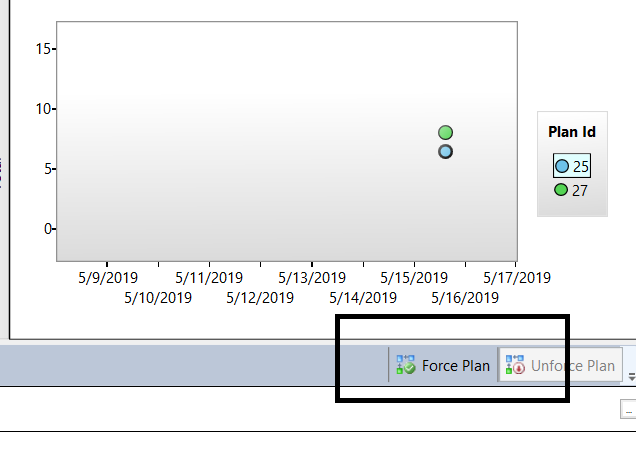
It is completed in approximately 80 milliseconds when it uses the top query plan.
When it uses the query plan at the bottom, it is almost complete in 0 milliseconds. You can see the details by coming over the rounds.
In some cases the query may work with an incorrect query plan for some reasons. For example parameter sniffing or out-of-date statistics.
You can find details in articles named “What is Parameter Sniffing” and “Statistics Concept and Performance Effect On SQL Server”.
When the query runs with the wrong query plan, it will decrease the performance of your query. Using the Query Store, you can detect and easily fix it.
For example, we have two query plans for our query in the Query Store. We can choose the faster one and choose Force Plan as below.
We have set the query plan to perform index seek. But as you know, there’s no index. Therefore, the query will not work with the query plan we set. In this case, it chosse the best query plan itself.
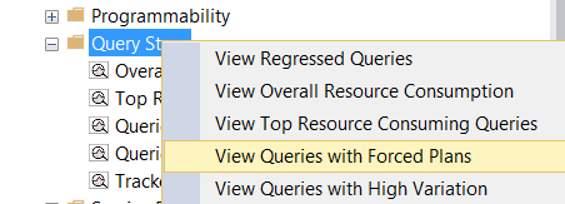
Right click on the Query Store and click on “View Queries with Forced Plans” to access the enforced query plans.
![]()