 Database Tutorials MSSQL, Oracle, PostgreSQL, MySQL, MariaDB, DB2, Sybase, Teradata, Big Data, NOSQL, MongoDB, Couchbase, Cassandra, Windows, Linux
In this article, we will build our own monitoring systems and build a structure to monitor all your systems on an open-source infrastructure. We will use grafana with prometheus.
I will describe Prometheus(Time series database) and Grafana(a technology we will use for the dashboard) installation.
We will perform our installations on Ubuntu 16.04.
Prometheus Installation
First, let’s perform the Prometheus installation.
Step1: Download Packages
In the first step, download additional packages that we will use on the server.
1 2 | apt install wget apt install vim |
Step2: Download Prometheus
You can download the version you want at https://prometheus.io/download/ link. In our example, we will download Pre-Release version.
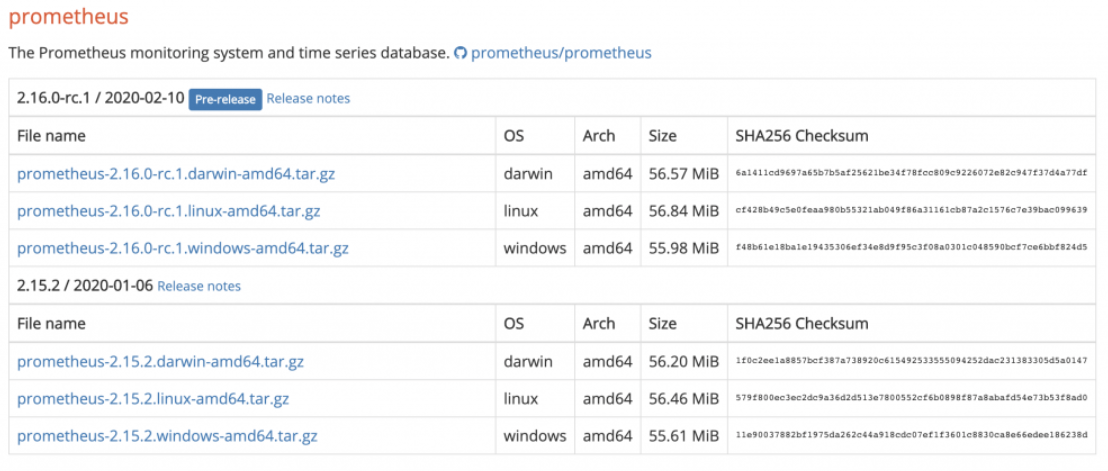
1 | wget https://github.com/prometheus/prometheus/releases/download/v2.16.0-rc.1/prometheus-2.16.0-rc.1.linux-amd64.tar.gz |
Extract downloaded file with the command below.
1 | tar xvzf prometheus-2.16.0-rc.1.linux-amd64.tar.gz |
Go to the extracted directory.
1 | cd prometheus-2.16.0-rc.1.linux-amd64 |
We open the config file and make the changes below. (We configure our configuration file as we want.)
1 | vim prometheus.yml |
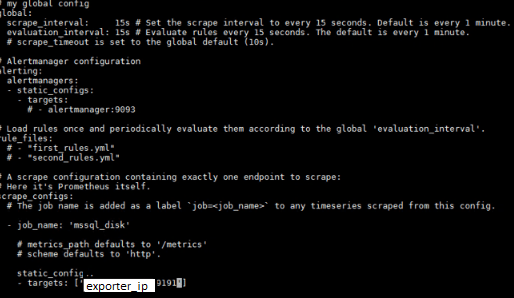
We reduce the scrape_interval to 1 second in our example.
1 2 | global: scrape_interval: 1s |
We also edit static_configs and add 9091. We generally recommend that you write your IP here instead of localhost.
1 2 | static_configs: - targets: ['localhost:9090', 'localhost:9091'] |
After editing the .yml file, let’s create our service file. For this we go to the path below.
1 | cd /etc/systemd/system |
We create a service file.
1 | vi prometheus.service |
Then you need to modify the service content below according to your system.
Service file content;
1 2 3 4 5 6 7 8 9 10 11 12 13 14 15 | [Unit] Description=Prometheus Service Documentation=sqltr After=network.target StartLimitIntervalSec=0 [Service] Type=simple Restart=on-failure RestartSec=10 ExecStart=/home/ubuntu/prometheus-2.16.0-rc.1.linux-amd64/prometheus \ --config.file /home/ubuntu/prometheus-2.16.0-rc.1.linux-amd64/prometheus.yml [Install] WantedBy=multi-user.target |
Run deamon-reload after creating the service.
1 | systemctl daemon-reload |
Then let’s start our service.
1 | systemctl start prometheus.service |
Check the service status.
1 | systemctl status prometheus.service |
Now our service is started. We must be able to open prometheus from the browser.
1 | http://localhost:9090/graph |
NOTE: When configuring the .yml file, I suggested that you write IP information instead of localhost in the static_configs section.
1 | http://<IP>:9090/graph |
Grafana Installation
Now we proceed to the installation steps of Grafana.
We are updating our server before installation;
1 | sudo apt update |
Now, we add the Grafana gpg key and install the packages.
1 2 | sudo apt-get install -y gnupg2 curl software-properties-common curl https://packages.grafana.com/gpg.key | sudo apt-key add - |
We are downloading the Grafana APT repository.
1 | sudo add-apt-repository "deb https://packages.grafana.com/oss/deb stable main" |
We are updating again and downloading the graphana.
1 2 3 | sudo apt-get update sudo apt-get -y install grafana |
Start grafana service.
1 | sudo systemctl start grafana-server |
Check service status.
1 | sudo systemctl status grafana-server |
Now we can open grafana in our browser.
1 2 3 4 5 | http://<IP>:3000 user - pass information on first logon: user: admin pass : admin |
How To Use Grafana With Prometheus?
We installed grafana and prometheus. Now lets perform a test. We will create a dashbord that monitor PostgreSQL. We use an exporter which created by Wrousnel. You can see his queries from the below link. To see the queries, click queries.yaml from the below link.
https://github.com/wrouesnel/postgres_exporter
This exporter will listen PostgreSQL and transfer PostgreSQL metrics to prometheus.
Run PostgreSQL Exporter
First we run postgres exporter.
It runs the queries by listening to postgresql using the ip and port we specified in the query.
It was run from the docker to make it easier.
1 2 | docker run --net=host -e DATA_SOURCE_NAME="postgresql://user:password@your_postgres_ip:your_postgres_port/postgres?sslmode=disable" -e PG_EXPORTER_WEB_LISTEN_ ADDRESS=0.0.0.0:9191 wrouesnel/postgres_exporter |
The above code will run wrouesnel’s queries in the postgresql we have specified. Exporter will listen from the server we executed the above query from 9191 port.

Grafana add Prometheus Query
If you download the above link’s content as zip file to the docker above, and extract the zip file, you can change queries as you want and integrate prometheus and grafana with your own queries.
Let’s edit Prometheus yml.
Exporter listens on port 9191 and runs the queries in the PostgreSQL in the time interval we set in scrape_interval.
Configure prometheus yml
exporter_ip is the ip of the server which we run the exporter script. Its same ip with prometheus_ip since I have executed postgres exporter on prometheus server.
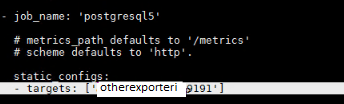
We can add job names as below for exporter working on other ip and ports.
We go to the path where Prometheus is installed. We can run it with the command ./prometheus.
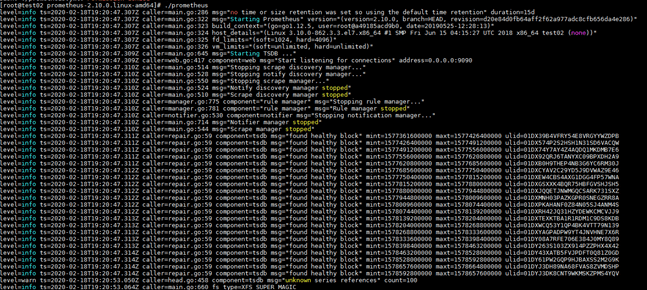
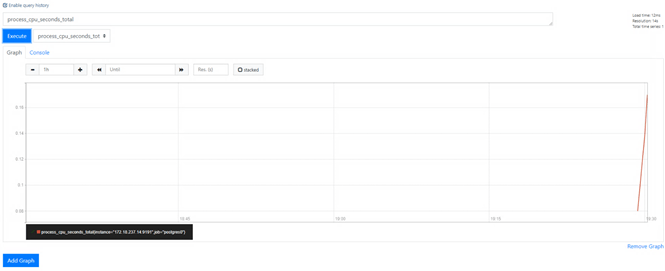
On the server we run Prometheus, we can look at the metrics from the exporter as below in the default 9090 port. 9090 is the default port of Prometheus. Do not confuse exporter port and prometheus port.
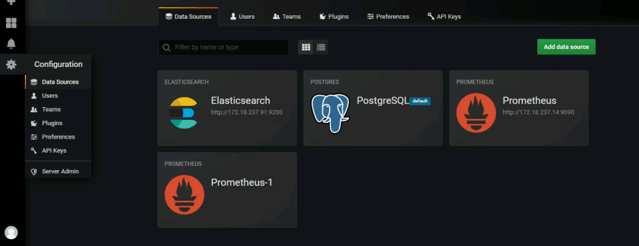
Then we can add the prometheus to the grafana as a data source.
Grafana Dashboard Sample Screenshot:
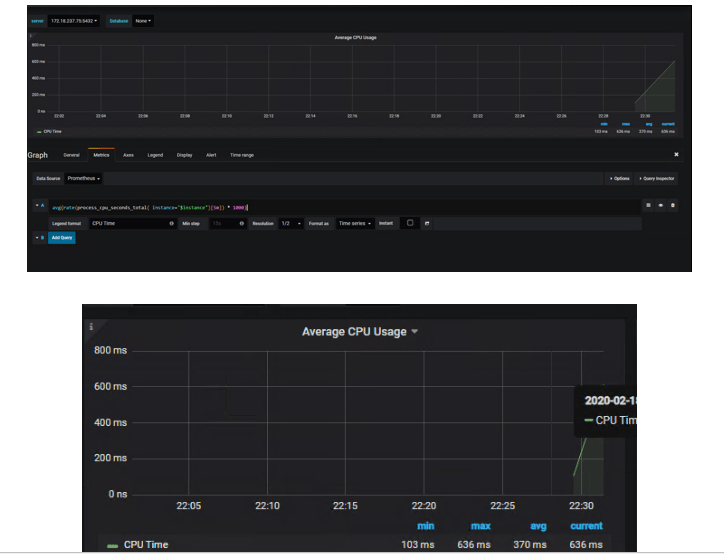
![]()