 Database Tutorials MSSQL, Oracle, PostgreSQL, MySQL, MariaDB, DB2, Sybase, Teradata, Big Data, NOSQL, MongoDB, Couchbase, Cassandra, Windows, Linux
In order to find long running queries in PostgreSQL, we can set the log_min_duration_statement parameter in the postgresql.conf file to a certain threshold value and ensure that the queries that is longer than this threshold are written to the log file. This configuration helps us find long running queries. We cannot see queries that take less than the threshold we have specified.
The pg_stat_statements extension records statistics for all SQL queries running in the database. It is one of the most important extensions that can be used to detect performance problems. It allows us to obtain information such as total elapsed time, number of rows, execution count for each query run in the database where it is created.
How To Install pg_stat_statements Extension
We install the contrib package in the version of our current PostgreSQL Cluster:
For CentOS / Redhat distributions:
1 | sudo yum install postgresql12-contrib |
For Debian based distributions:
1 | sudo apt-get install postgresql-contrib-12 |
We edit the shared_preload_libraries parameter in the postgresql.conf file to include the pg_stat_statements module as follows:
1 2 3 | vim /var/lib/pgsql/12/data/postgresql.conf > shared_preload_libraries = 'pg_stat_statements' |
Or, we can set it using the ALTER SYSTEM SET command by connecting to PostgreSQL as follows:
1 | ALTER SYSTEM SET shared_preload_libraries TO 'pg_stat_statements'; |
In order for the change in shared_preload_libraries parameter to take effect, the PostgreSQL service must be restarted, we restart the service as follows:
For CentOS / Redhat distributions:
1 | sudo systemctl restart postgresql-12 |
For Debian based distributions:
1 | sudo systemctl restart postgresql@main-12 |
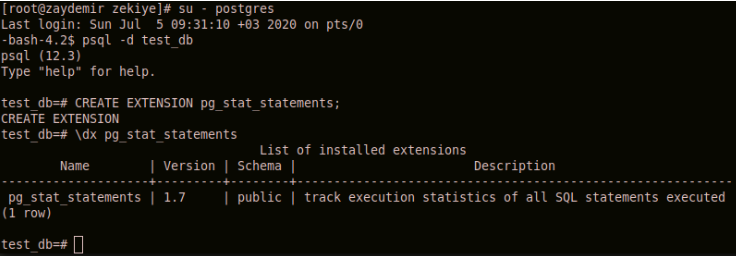
We connect to the database where we want to monitor the query statistics with a user with superuser rights and create the extension:
1 | CREATE EXTENSION pg_stat_statements; |
We can display the pg_stat_statements extension we created with \dx as follows:
We can see the query with the highest average runtime in the database as follows:
1 2 3 4 | SELECT total_time, min_time, max_time, mean_time, calls, rows, query FROM pg_stat_statements ORDER BY mean_time DESC LIMIT 1; |
Example command output is as follows:
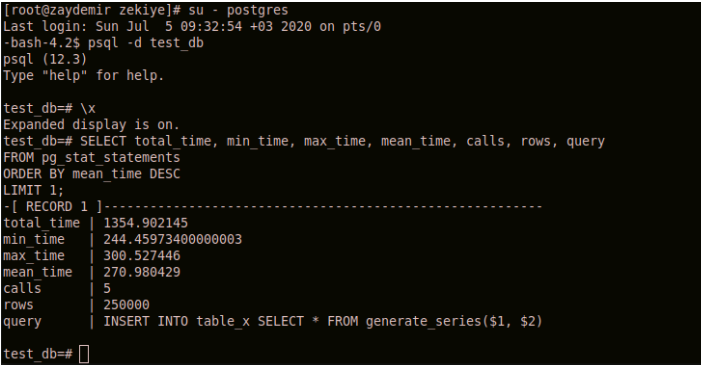
total_time in pg_stat_statements: Returns the total runtime of the query in milliseconds.
min_time & max_time in pg_stat_statements: Returns the minimum and maximum runtimes of the query.
mean_time in pg_stat_statements: Returns the average run time of the query in milliseconds with total_time / calls.
calls in pg_stat_statements: Returns the total number of times the query was run.
rows in pg_stat_statements: Returns the total number of rows returned or affected as a result of the query.
query in pg_stat_statements: Returns the running query. By default, up to 1024 bytes of the query are displayed. You can change this value with the track_activity_query_size parameter.
Change pg_stat_statements max query count:
By default, the pg_stat_statements extension stores statistics for the first 5,000 queries it encounters. We can change this number by editing the parameter pg_stat_statements.max. The PostgreSQL service must be restarted for the change in the parameter to take effect.
As an example, we can set it to 10000 as follows:
1 | ALTER SYSTEM SET pg_stat_statements.max TO 10000; |
Reset pg_stat_statements Statistics:
Statistics obtained by pg_stat_statements accumulate until reset.
You can run the following function by connecting to the database with a user with superuser rights to reset the statistics data:
1 | SELECT pg_stat_statements_reset(); |
In this article I mainly mentioned the use of pg_stat_statements. For more detailed information, you can look at below link;
https://www.postgresql.org/docs/12/pgstatstatements.html
![]()
Very Informative!!!
the query are outdated and do not work