 Database Tutorials MSSQL, Oracle, PostgreSQL, MySQL, MariaDB, DB2, Sybase, Teradata, Big Data, NOSQL, MongoDB, Couchbase, Cassandra, Windows, Linux
In this article, I will explain the integration of metricbeat with postgresql and show how to create dashboards by using metricbeat.
I shared what Metricbeat is and how to install and elasticsearch integration in my article “How To Install Metricbeat on Centos“.
First I’ll continue with postgresql12. For those who need Postgresql 12 installation, you can use the article “How To Install Streaming Replication in PostgreSQL 12“.
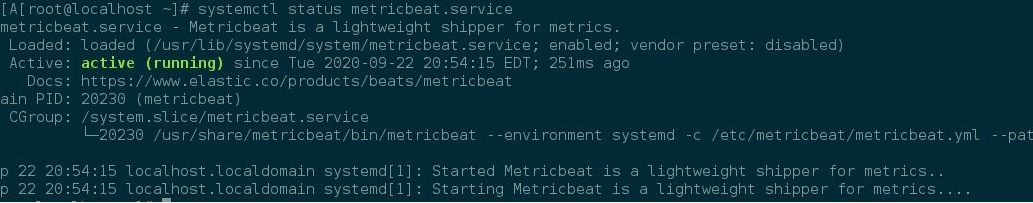
Before starting the configurations, let’s make sure that our metricbeat service is running.
1 | systemctl status metricbeat |
Enable Metricbeat PostgreSQL Module
Now that our service is running, we enable our postgresql module.
1 | metricbeat modules enable postgresql |
Configure postgresql.yml for Metricbeat
After enabling the postgresql module in metricbeat, we edit the yml file in the following directory to connect with postgresql.
1 | vi /etc/metricbeat/modules.d/postgresql.yml |
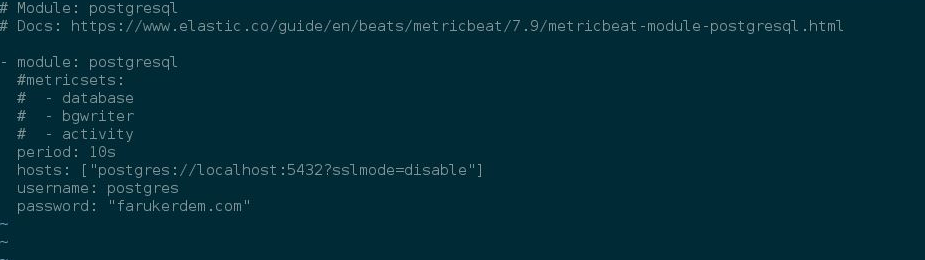
Descriptions of the above parameters:
In the Metricsets section, there are parameters for database, bgwriter, activity metrics to be collected.
period: How many seconds the data will be transferred every second.
I suggest you add the “? sslmode = disable” parameter to the end of the ip port information in hosts: postgresql.
username: where the postgresql username is specified.
password: where the postgresql user’s password is specified.
After specifying these parameters, we run the following command.
1 | metricbeat setup |
Metricbeat PostgreSQL Dashboard
After the command is completed successfully, we can view the dashboards on kibana as follows.
Go to the Dashboards section by clicking the button next to the Elasticsearch icon in the upper left.
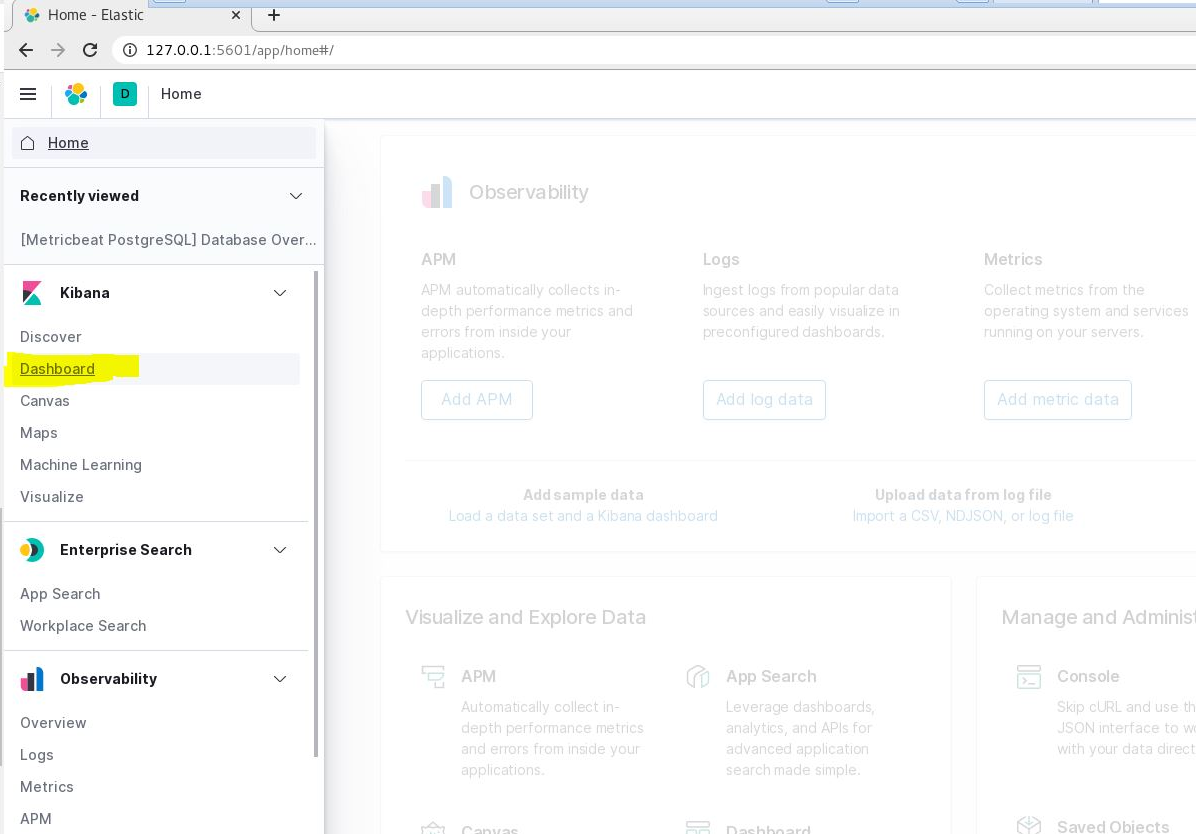
On the Dashboards page, we type PostgreSQL and click the search button and we can monitor the postgresql with the [Metricbeat PostgreSQL] Database Overview].
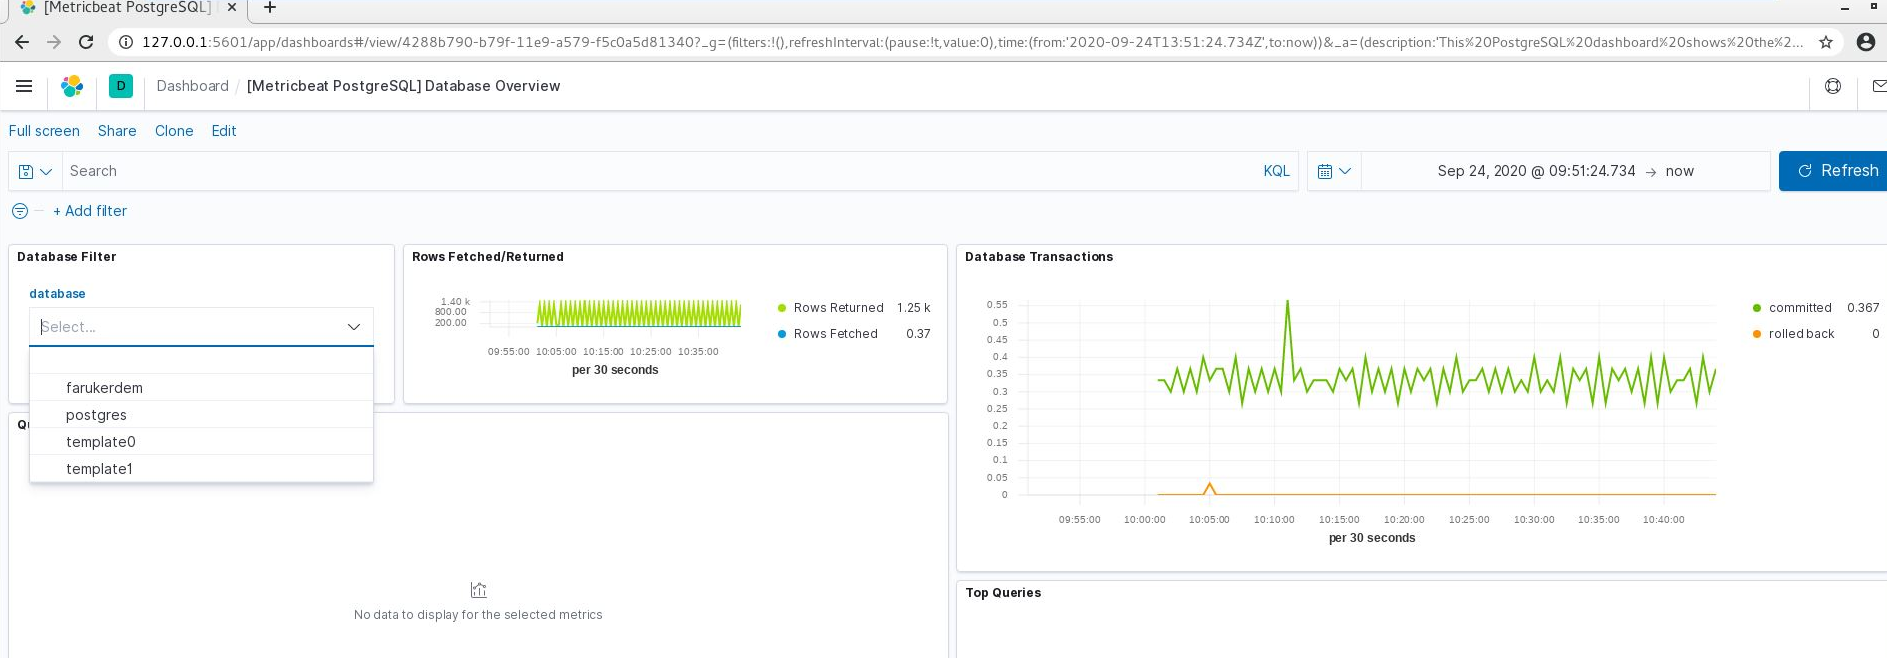
![]()