 Database Tutorials MSSQL, Oracle, PostgreSQL, MySQL, MariaDB, DB2, Sybase, Teradata, Big Data, NOSQL, MongoDB, Couchbase, Cassandra, Windows, Linux
I recommend reading “How To Monitor SQL Server with Utility Control Point” and “How To Add an Instance To The Utility Control Point” to create Utility Control Point and add all your instances to this control point.
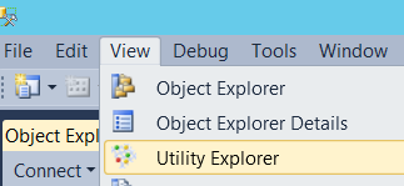
To configure the utility control point, click View utility Explolor on SSMS as follows.
We click on the Utility Administration screen on the screen that appears.
The following settings are listed on the right side under “global policies for Managed Instance”.
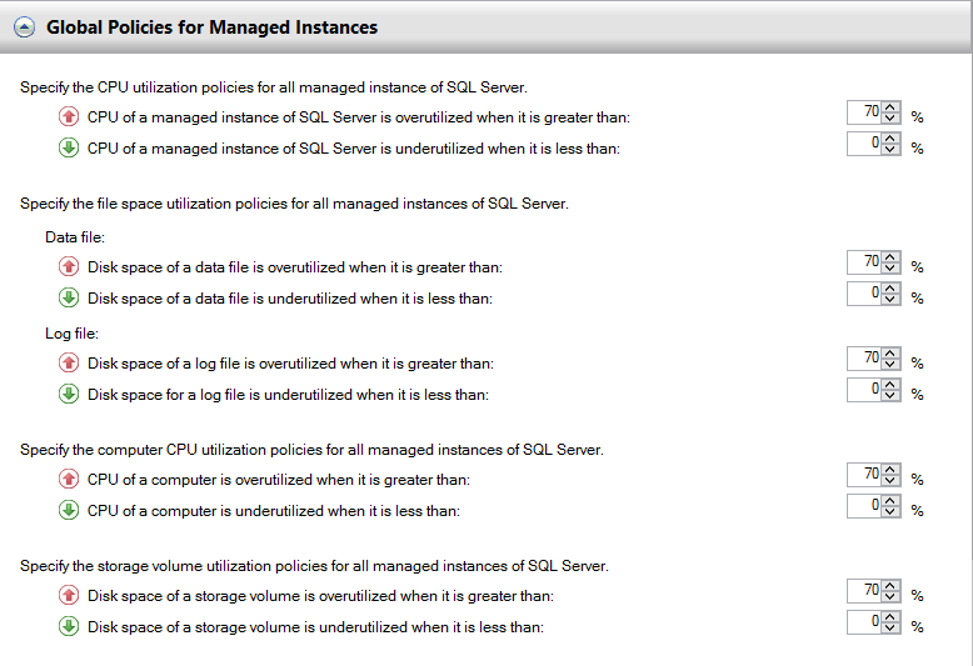
Below you can find information about the settings in the screenshot above.
Specify the Cpu utilization policies for all managed instance of SQL Server:
We make the necessary configurations to alert us when the Managed Instance’s CPU is above a certain level.
For example, “CPU of a Managed Instance of SQL Server is overutilized when it is greater than” is set to 70%. If the CPU used by instance goes above 70%, it will warn us. You can set this value according to your needs on your system.
Specify the file space utilization policies for all managed instance of SQL Server:
It consists of two parts: Data File and Log File.
For Data File, “Disk space of a data file is overutilized when its greater than” is set to 70%. It will warn you if the data file uses more than 70%. That’s a little unreasonable for me. Because the database grows continuously and you open autogrowth.
We can make this setting for the Log file in the Log File section.
It would be a little more logical to do this setting for the log file. Because the log file usually remains at certain size. And if the recovery model of the database is full, we can periodically log backup and ensure that the “log file” is truncate.
For detailed information, I suggest you read my article “What is Database Recovery Model“.
Specify the computer CPU utilization policies for all managed instance of SQL Server:
Here we are also setting the cpu percentage of the servers(not only instance).
Specify the storage volume utilization policies for all managed instance of SQL Server:
Here we are setting the occupancy percentage of the disks on the server.
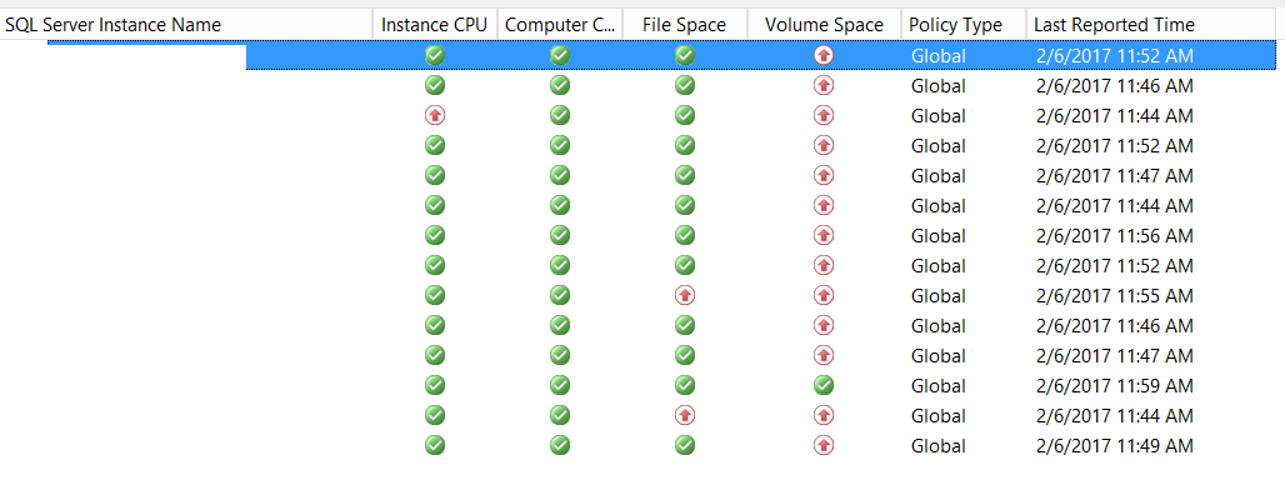
To get more detailed information, after selecting the relevant instance, we look at the screen below. You can see detailed information in the CPU Utilization section.
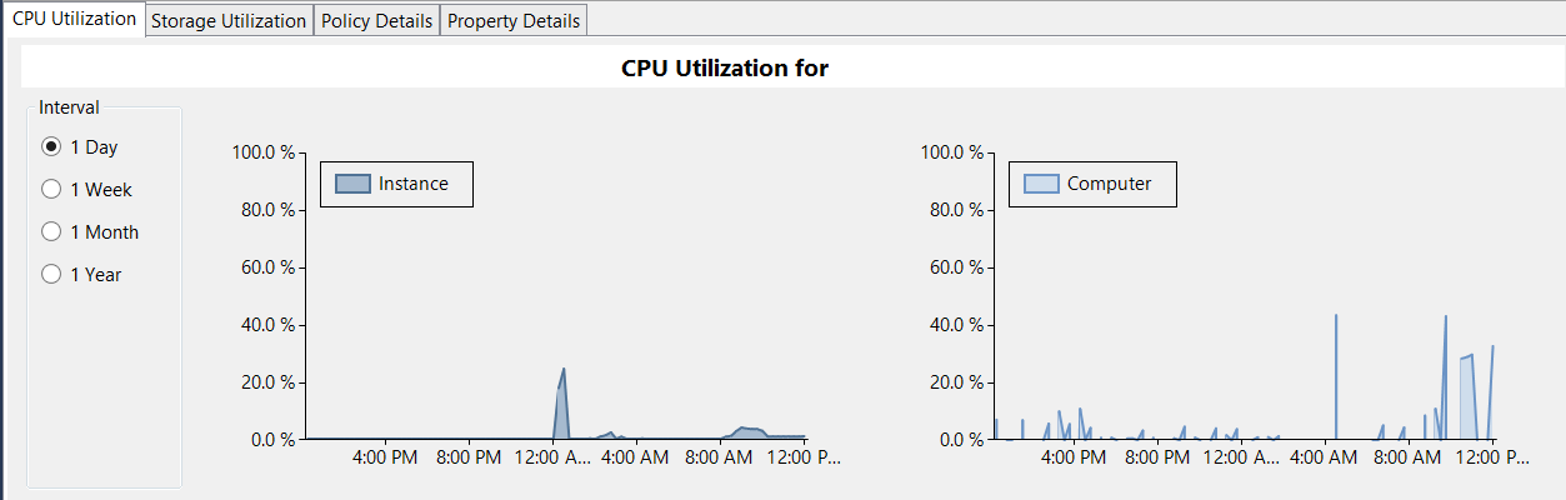
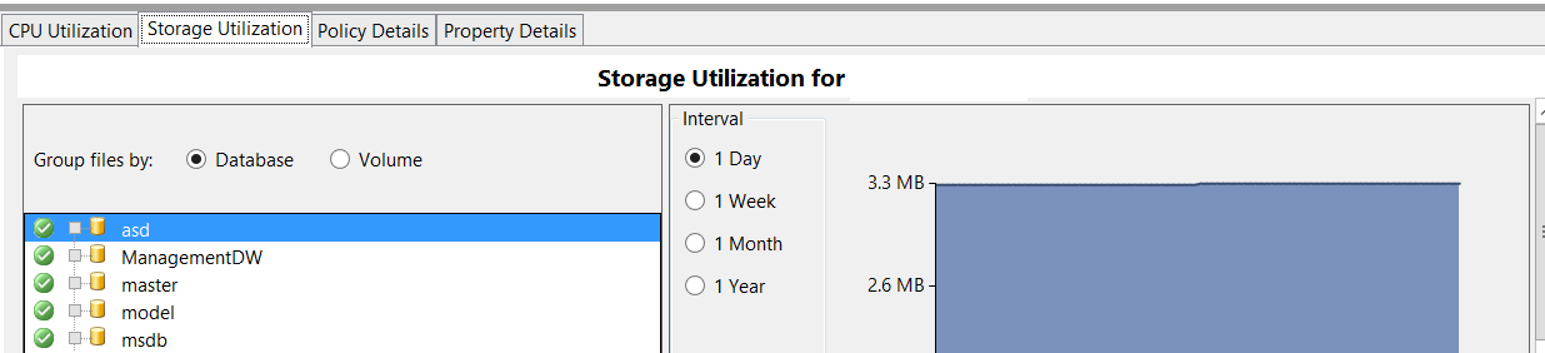
If we choose Database from the Storage Utilization section, we can access various information, such as the growth rate of the database.
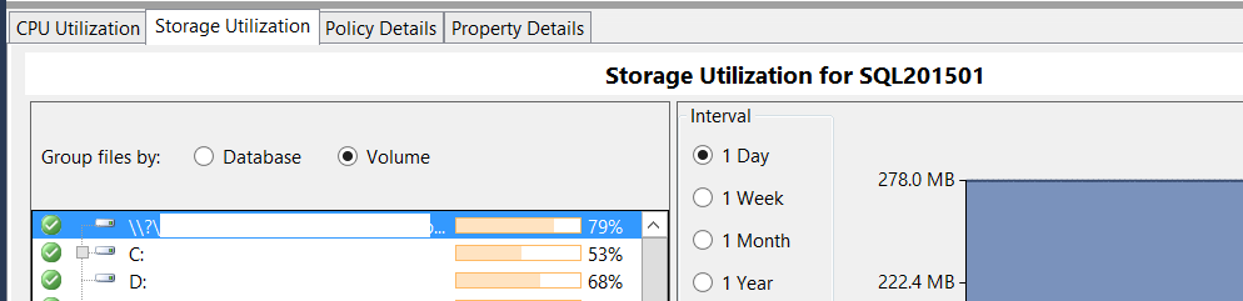
If we choose Volume, we’ll see how much free space on that disk.
In general, we can see the growth rate of all databases, CPU utilization rates of all instances and servers in detail. We can also define alerts to alert us when the use rates of these resources are above a certain level.
![]()