 Database Tutorials MSSQL, Oracle, PostgreSQL, MySQL, MariaDB, DB2, Sybase, Teradata, Big Data, NOSQL, MongoDB, Couchbase, Cassandra, Windows, Linux
Utility Control Point works in an integrated manner within SQL Server and is used to monitor SQL Server. I can say that it is a good way to monitor CPU utilization rates and disk occupancy rates. It also keeps historical information during the time it is monitored.
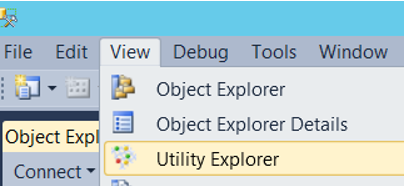
Click on View Utility Expolorer via SSMS
We see a screen like the one below. On this screen, click Create a Utility Control Point (UCP).
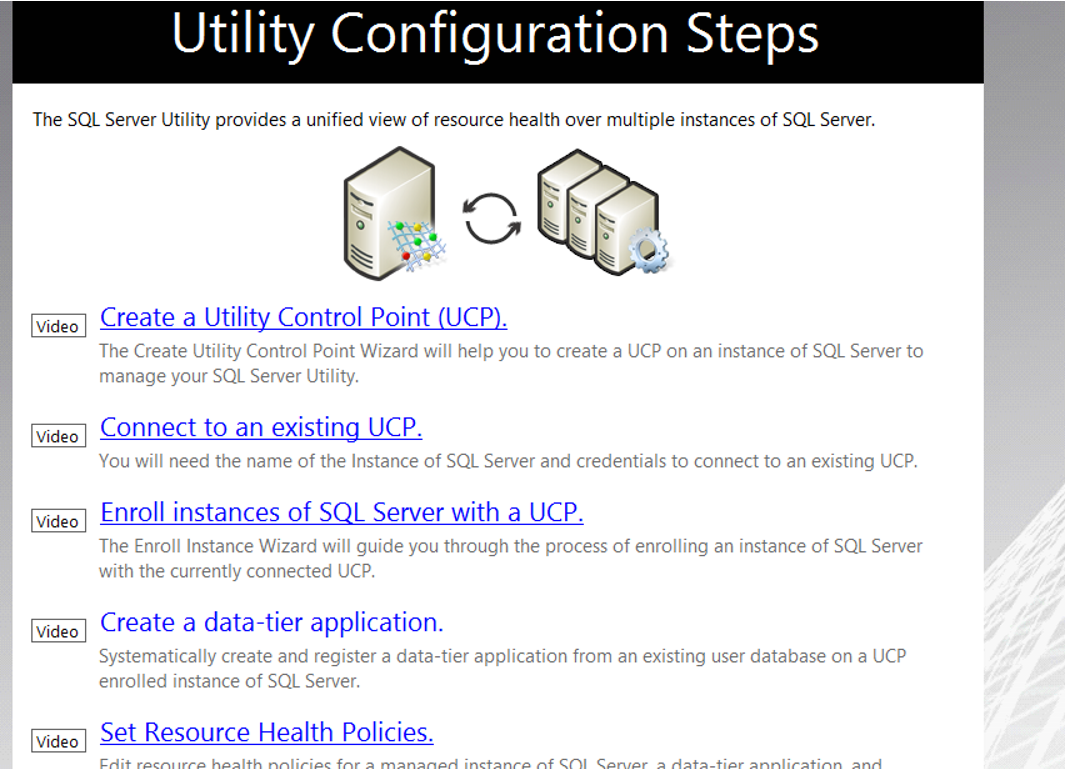
We select “Do not show this page again” on the screen and click next.
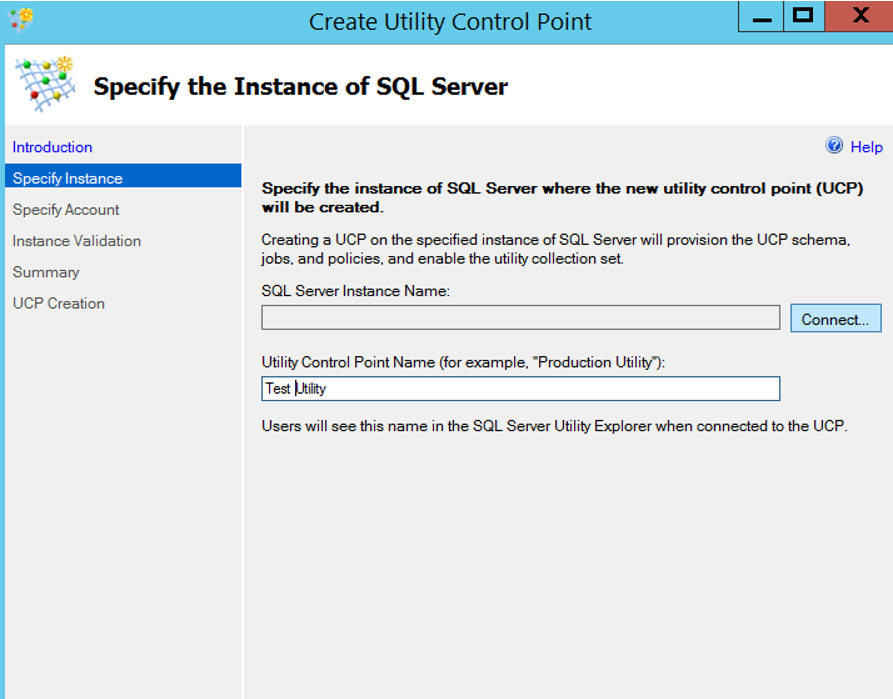
As you can see on the next screen below;
In the SQL Server Instance Name section, click Connect and select Instance to create the Utility Control Point.
We give a name in Utility Control Point Name section. We gave Test Utility in our example.
Click Next to proceed.
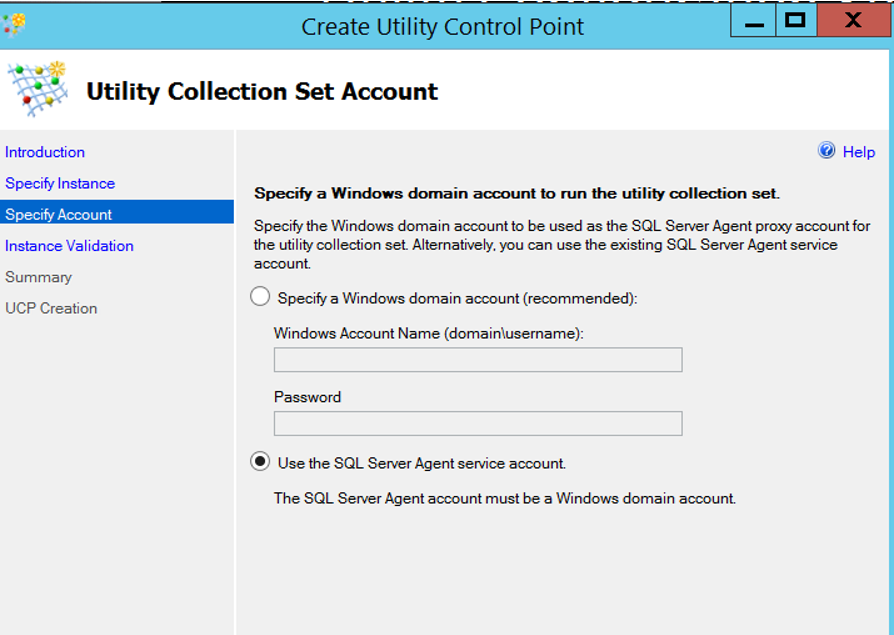
For the user account that will run the utility control point, select “Use the SQL Server Agent service account” and click next.
The SQL Server Agent Service account must be a domain user so that we do not get an error in the installation. You can check this from Configuration Manager. You can find detailed information in my article “SQL Server Configuration Manager Settings“.
If you receive a WMI error, you must authorize the SQL Server Service Account on WMI. You can learn how to do this in my article “How to Authorize a User on WMI“.
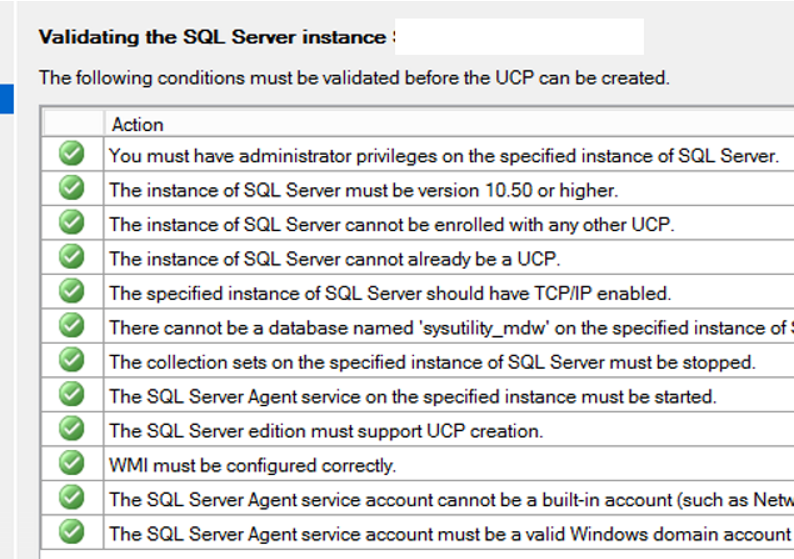
After all checks are completed successfully as below, we are completing the installation by clicking next next and finish.
We have completed the utility control point installation on a single instance. In my article, “How To Add an Instance To The Utility Control Point“, I explained how to monitor all instances from one location by adding another instance to an existing utility control point. You can install a separate utility control point on each instance, but it will make the monitoring difficult. In addition, it is easier to monitor all instances from a single point.
In the article “How To Manage Utility Control Point“, I explained the settings needed to monitor resources such as disk and cpu.
For example, if the CPU exceeds 90% or the fre space on the disk falls below 10%, we can set it to alert us.
![]()