 Database Tutorials MSSQL, Oracle, PostgreSQL, MySQL, MariaDB, DB2, Sybase, Teradata, Big Data, NOSQL, MongoDB, Couchbase, Cassandra, Windows, Linux
As a database administrator, you need to know the features of the storage that you want to use for your databases. You don’t want to buy more than you need. Therefore, you must calculate your IOPS and throughput of your database server.
IOPS(Input/Output Operations Per Second): Number of reads and writes in seconds
Throughput: Indicates how many mb reads or writes can be done per second. Throughput is calculated using IOPS and BlockSize (Allocation Unit Size) parameters like below.
Throughput=IOPSxBlockSize/1024
Block Size: For more information about BlockSize, please read the following article.
“How To Use Database Disks with Maximum Performance”
Manufacturers generally assume BlockSize to be 4K when calculating storage throughput. But recommended for SQL Server is 64K. Because SQL Server usually reads and writes 64K.
How do we calculate the IOPS of our database server?
There are many methods for this. But the best thing is to ask the manufacturers of your existing storage to do this test.
Most organizations and companies do not do this when buying storage. In this article we will calculate database server’s IOPS.
We can think of IOPS as frontend IOPS and backend IOPS..
Frontend IOPS is the IOPS on the server side. Backend IOPS is the IOPS on the storage side.
First, we need to calculate the frontend IOPS of all the disks on the server. We will use the perfmon counters to perform this calculation.
When we press Enter by typing perfmon in the Search, we need to see a screen like below.
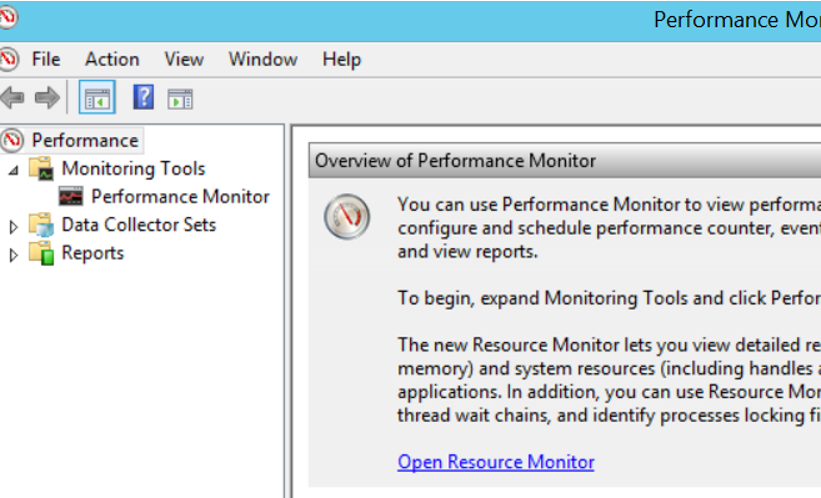
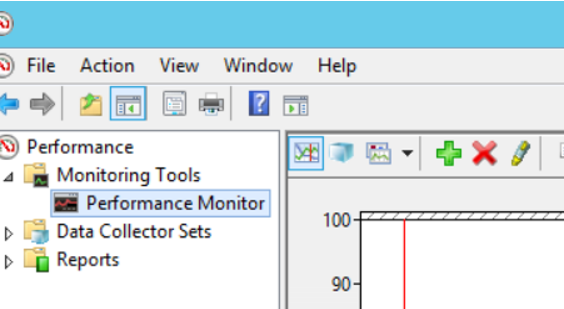
We click Performance Monitor on this screen. We click on the plus sign above the screen.
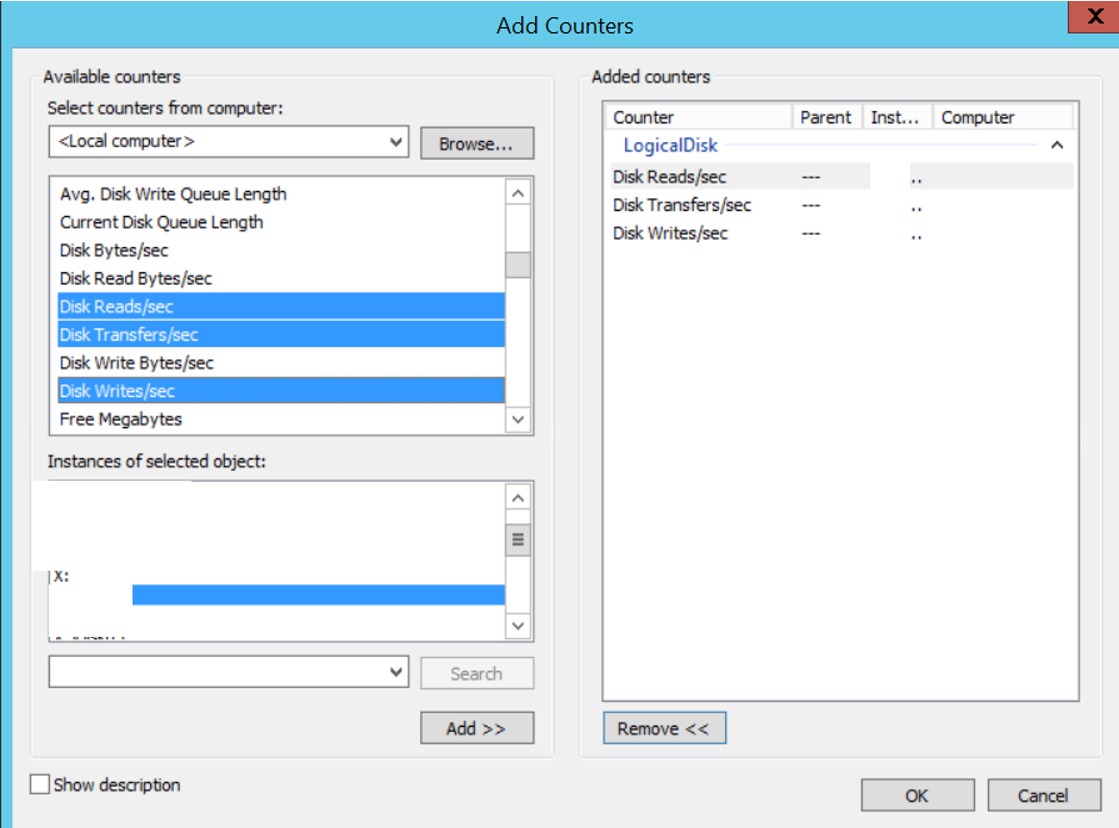
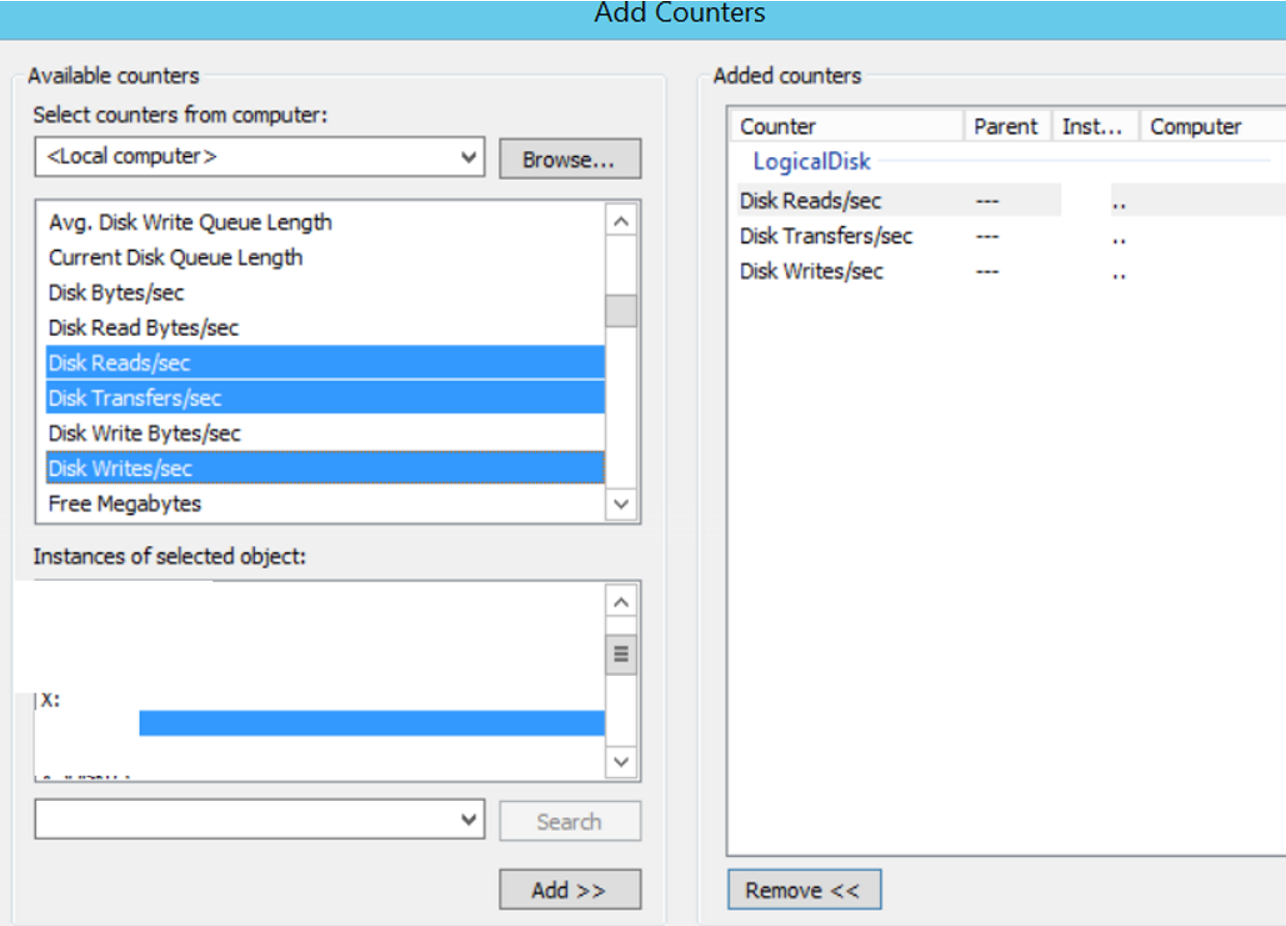
We select the following counters on the screen. With these counters selected, Select All disks we want to calculate and click Add.
| Disk Reads/Sec | Frontend Read IOPS |
| Disk Writes/Sec | Frontend Write IOPS |
| Disk Transfer/Sec | The sum of Frontend Read and Write IOPS |
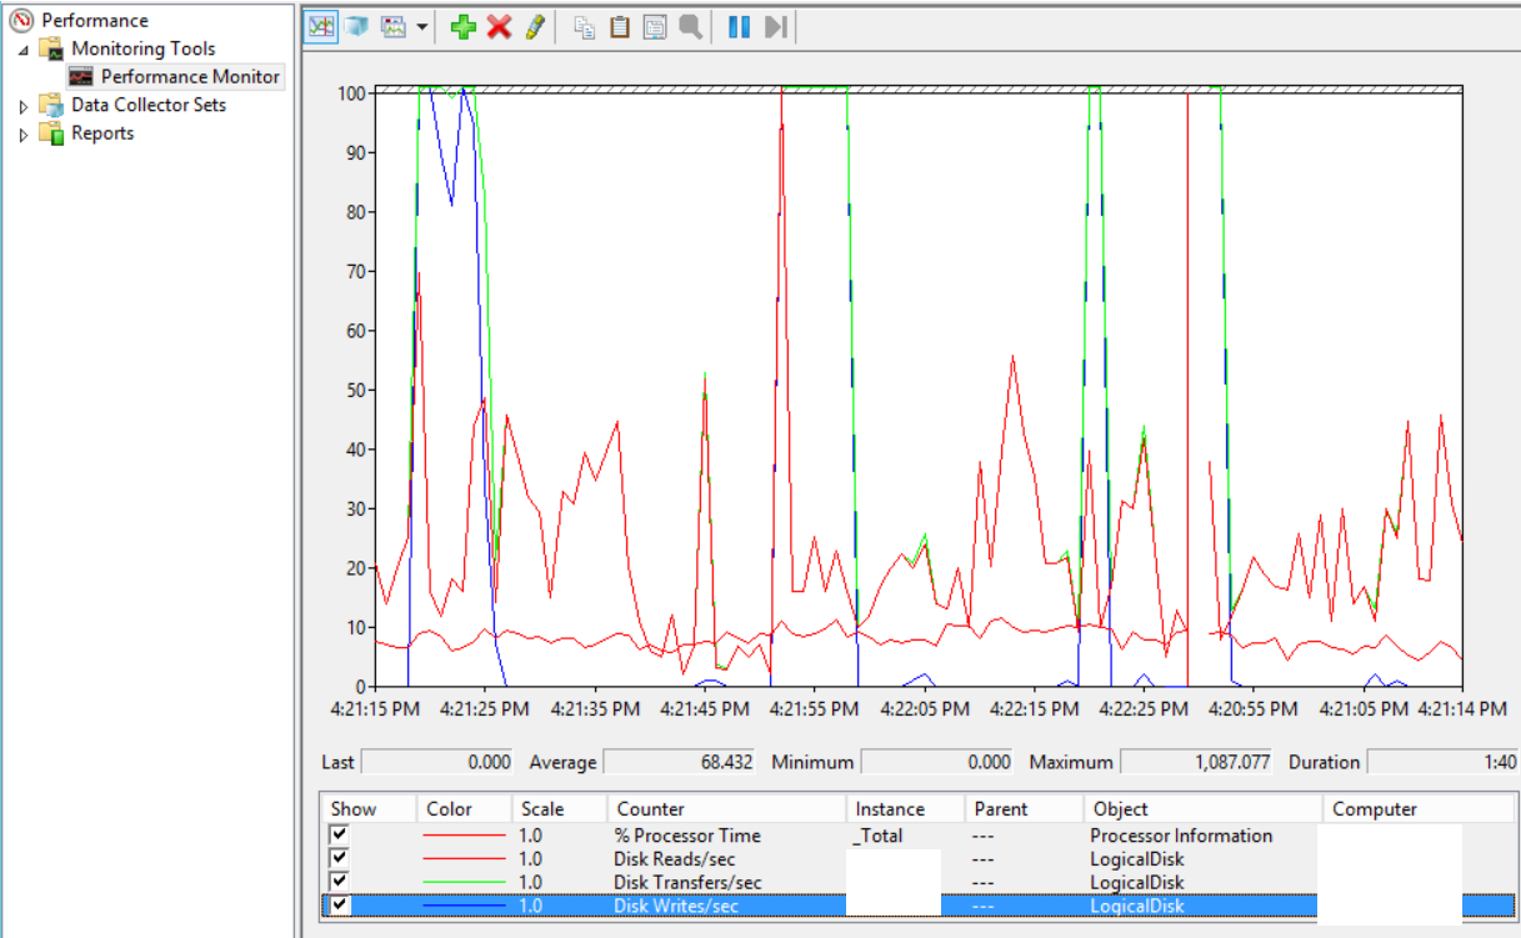
After setting these options, we will see a screen as below. You can follow the IOPS values instantly from this screen.
For example, Disk Writes/Sec has a maximum value of 1087 on the following screen.
Of course, you can only watch it in an instant. In order to obtain an average value, you must create collectors who constantly review these values. Think of it as the work that allows us to monitor it in the background.
So how do we create Data Collectors? Let’s create a data collector following IOPS.
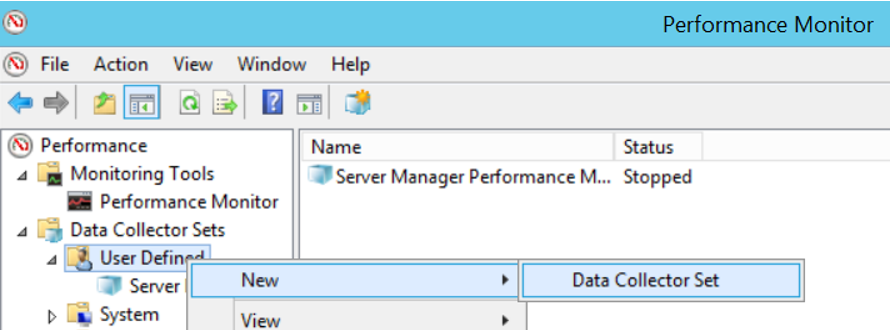
Right-click User Defined under Data Collector Sets as follows. We are choosing New-> Data Collector Set.
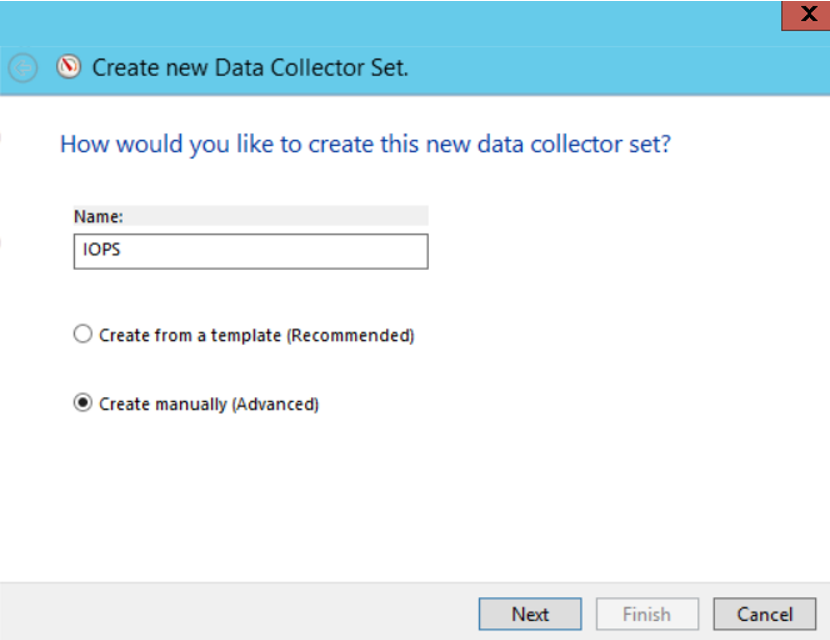
We give a name to our data collector set on the screen and select Create manually.
I named it IOPS. We’re moving forward.
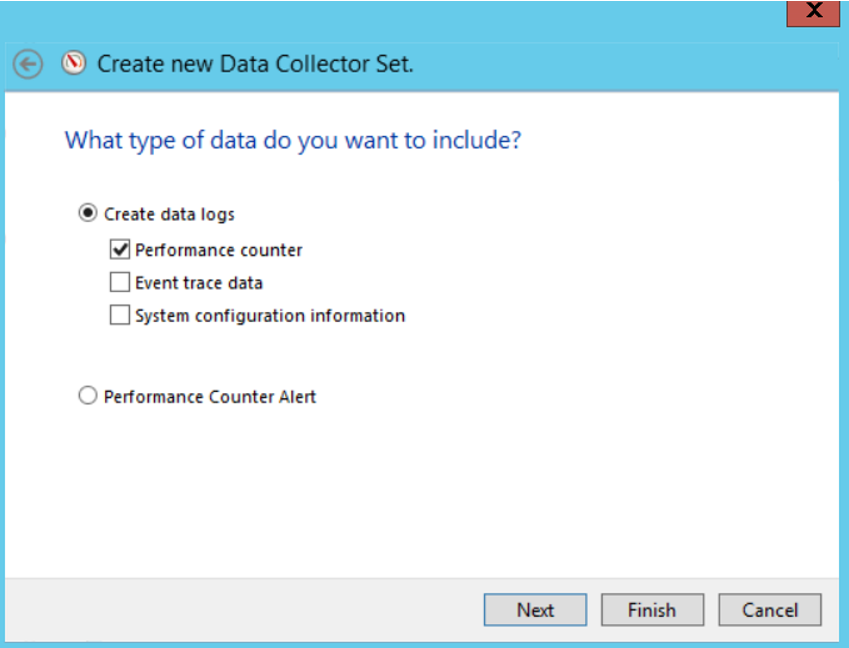
On the screen, select Performance counter from the Create data logs section and click Next.
We click Add from the incoming screen, and we add the counter we selected at the beginning of the article and click Next.
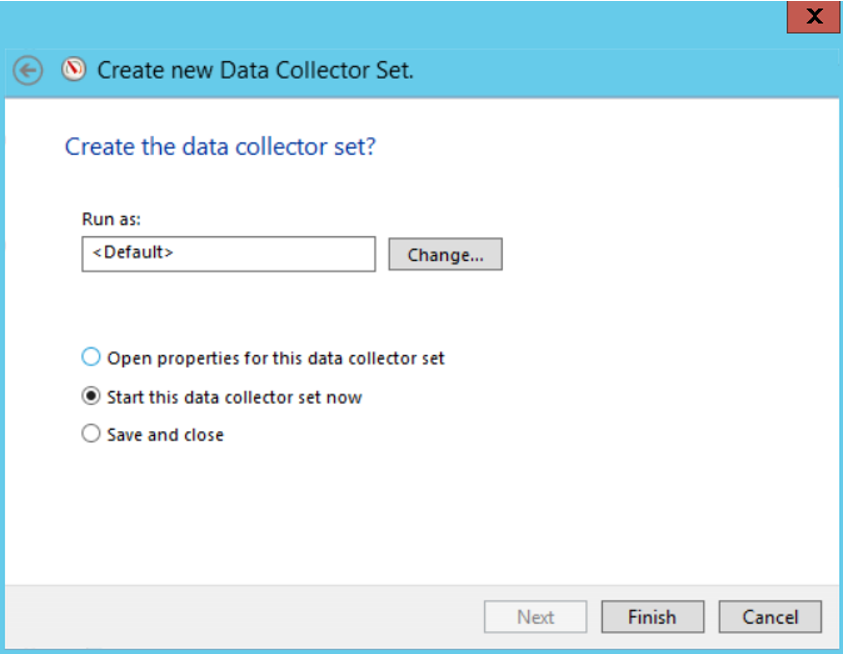
We’re proceeding by clicking next until we get to the screen below. In the following screen, select Finish by selecting Start this data collector set now.
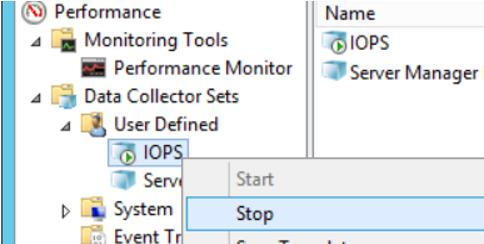
This collector logs in the background every 15 seconds by pulling the desired values from the system. Normally you need to do this logging for at least 1 month to get accurate results. Assuming that a month has passed, I stop the data collector as follows.
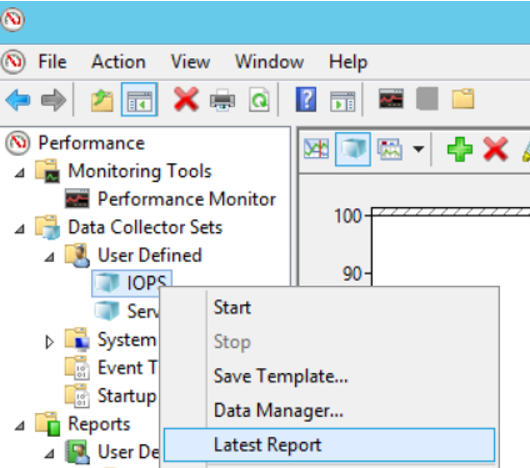
Right click after stop and click Latest Report.
I examine the maximum and average values of the values in the opened report. Personally, when I’m going to buy a storage, I take the maximum values. Because I want to get the maximum IOPS that the system really needs.
Of course, this is related to the budget of your organization. Less performance means less cost. If you get maximum values, the total value of Read and Write will not match Disk Transfer / Sec. The sum of the average values of Disk Reads / Sec and Disk Writes / Sec counter will be equal to the average value of Disk Transfer / Sec counter.
We get the maximum values in this report. In my example, these values are as follows.
| Disk Reads/Sec | 11.877 |
| Disk Writes/Sec | 156.124 |
| Disk Transfer/Sec | 169.440 |
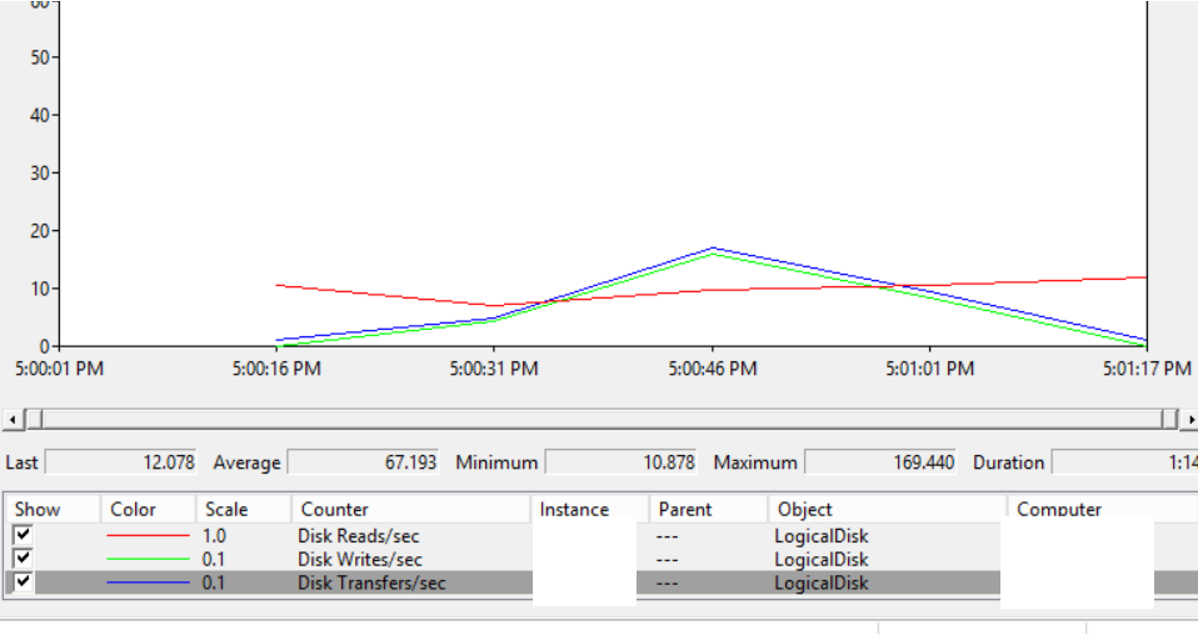
These values are Frontend IOPS values.
Backend (IOPS on the Storage side) is calculated as follows.
Let’s assume that the RAID structure is RAID 5. Penalty Value is a value that can reduce the IOPS on the storage side according to the RAID structure. Because in all RAID structures except RAID 0, data is written to multiple disks.
You may want to read my article “What is RAID” for RAID structures.
Real IOPS = (Total IOPS x Read Percentage) + (Total IOPS x Write Percentage x Penalty Value)
Let’s put our real values into the formula.
Total IOPS=169
Read Percentage=100*11/169=%6,5=0.065
Write Percentage=%93,5=0.935
Penalty Value=4
Real IOPS=(169×0.065)+(169×0.935×4)=10.985+632.06=643.045
Below you can find the table showing the penalty values of RAID structures.
| Raid Structure | Penalty Value |
| Raid 0 | 0 |
| Raid 1/10 | 2 |
| Raid 5 | 4 |
| Raid 6 | 6 |
| Raid DP | 2 |
![]()