 Database Tutorials MSSQL, Oracle, PostgreSQL, MySQL, MariaDB, DB2, Sybase, Teradata, Big Data, NOSQL, MongoDB, Couchbase, Cassandra, Windows, Linux
Data Collector is a feature introduced in SQL Server 2008. A nice technology to monitor and report the performance of SQL Server systems. We can use Data Collectors in several different ways.
You can monitor using Perfmon at “t” moment or create a baseline using “Data Collector Set”.
Baseline creation can usually be useful to detect the problem when there is a problem in the system.
For example, you have created a data collector set for the Buffer Cache Hit Ratio(Indicates how much of the queries are read from the buffer cache. You can find the details of the counter in the table at the end of the article.)
And there was a problem in the database at “t” moment.
You have checked the Buffer Cache Hit Ratio ratio from “Data Collector Set” at “t” and you saw that the rate fell to 70% at the time of the problem. This means that there is an insufficiency of memory at the time of the problem. In this way, the baselines you create with data collectors can help you to solve the problem.
You should read the article “How To Calculate IOPS and Throughput of Your Database Server Using Data Collector” to monitor the counter counts from Perfmon and create baseline with data collector sets.
Another use of Data Collectors is the Management Data Warehouse. With Management Data Warehouse, we can create a baseline via SSMS using data collectors. But in its default configuration, baselines for CPU, Disk, Memory and Network are created. It is also possible to create custom baseline but I can say that it is not easy.
If only the Disk and Cpu monitoring is enough for you, I recommend you to use Utility Control Point.
Below you will find articles about Utility Control Point.
“How To Monitor SQL Server With Utility Control Point“,
“How To Manage Utility Control Point“,
“How To Add an Instance To The Utility Control Point”
Let’s examine the installation of Management Data Warehouse with an example.
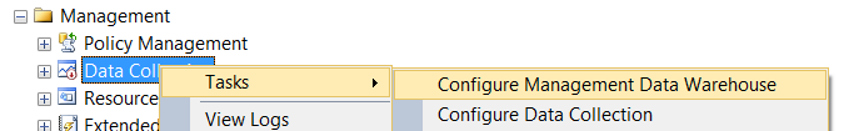
From the Management tab on SSMS, right click on Data Collection and click Tasks and Configure Management Data Warehouse.
In the screen that appears, we are moving forward by selecting “Do not show this page again”
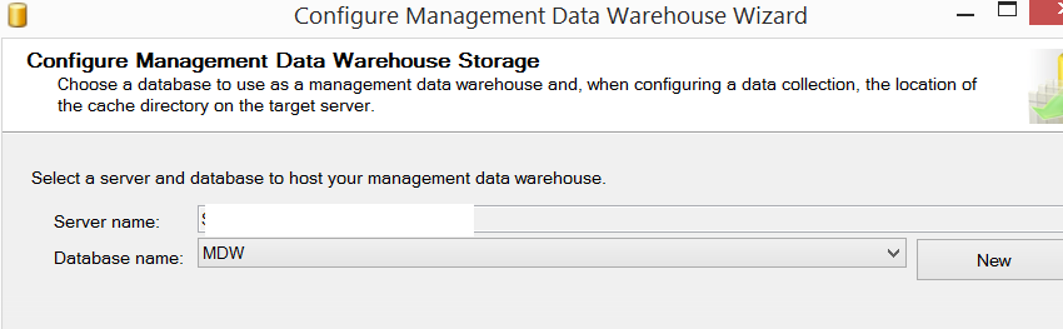
Management Data Warehouse needs a database to store the information it collects. On the next screen, it wants us to identify the database where it will save the information. We can select an existing database or we can create a new database for this process.
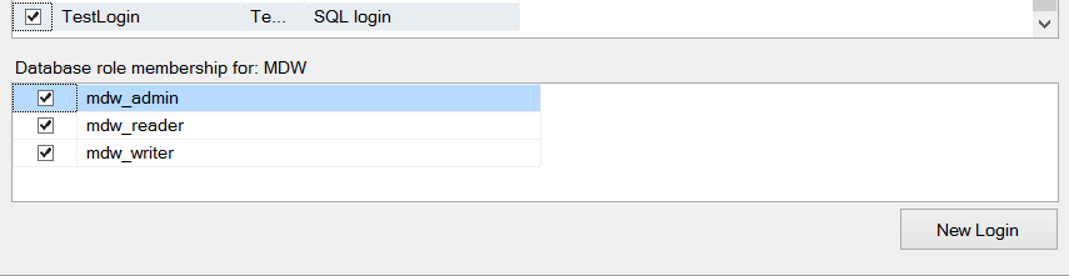
The next screen asks the user we want to authorize for the Management Data Warehouse. I’ve given admin rights to the TestLogin user. You can create a new login by clicking the New Login button.
The mdw_reader authorization is required for reporting, the mdw_writer authority is required to upload data, and the mdw_admin authorization is required to do both.
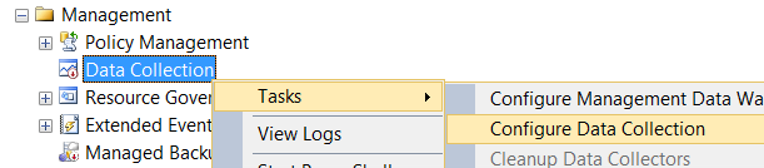
Next, click on Configure Data Collection as below to create our Data Collection Sets.
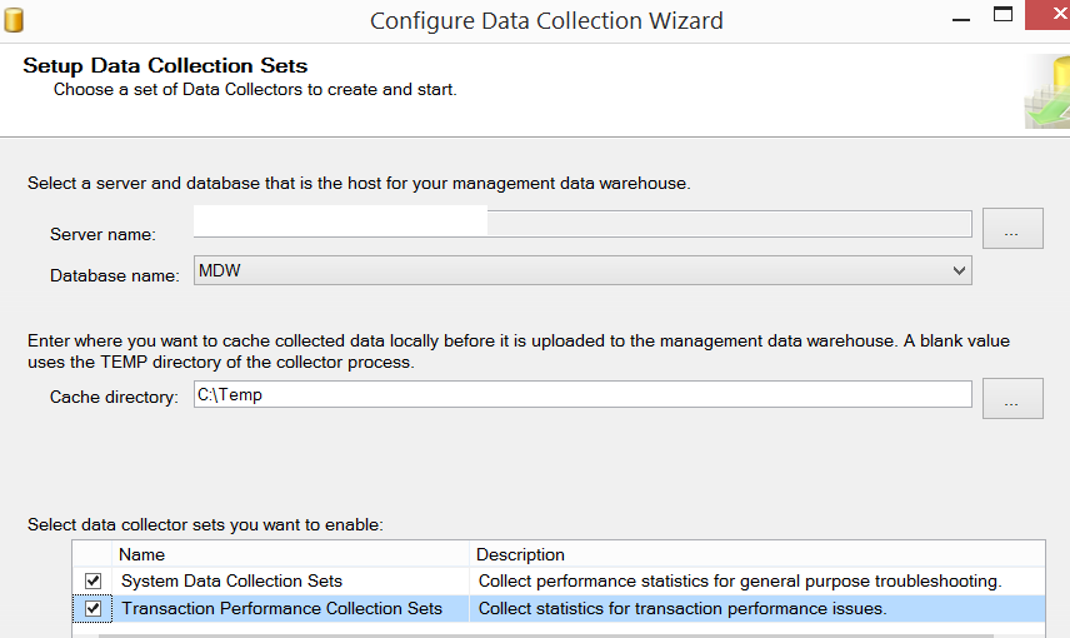
On the screen that appears,
In the Server name section, we select the instance of our MDW database that was created in the previous step.
In the database name section, we select our MDW database.
We need to select the file to keep before the data is transferred to the MDW database for Cache directory.
I created this folder on the C disk by creating a folder named Temp.
At the bottom, it asks for the data collector sets we want to activate. We select System Data Collection Sets and Transaction Performance Collection Sets and complete the process by clicking finish on the last screen.
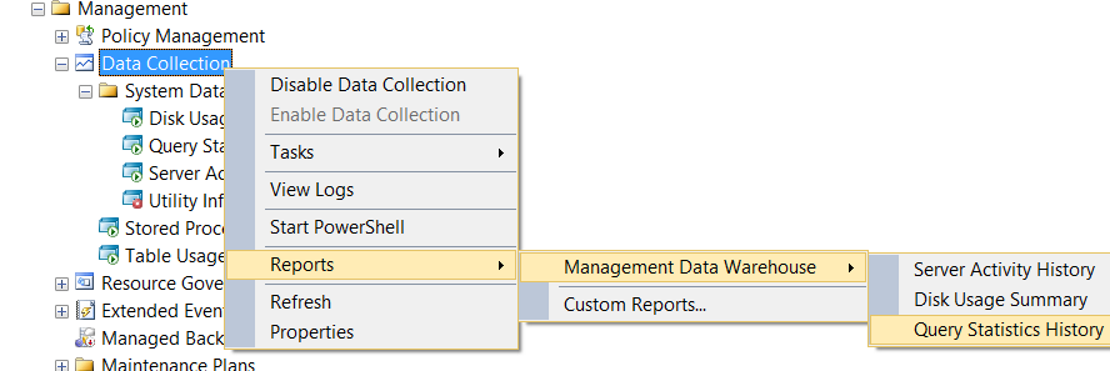
You can find reports from the Management> Data Collection> Reports> Management Data Warehouse tabs as follows.
In addition to the Management Data Warehouse, you can create a baseline with data collector sets using the counter you want, as described in the article “How To Calculate IOPS and Throughput of Your Database Server Using Data Collector“.
Below you can find some important counter and best practice.
| Object | Counter | Counter Description | The Range Of Values That Alert Can Be Generated: |
| Memory | Available MBytes | The amount of free memory in the system | < 3 GB |
| Memory | Pages Input/Sec | Number of pages accessed from disk per second (hard page fault) | > 20(Average) |
| Paging File | %Usage | Paging File usage rate | > 70% |
| Processor | Privileged Time | The time that Windows Kernel processes spend on the CPU. Indicates a high amount of I/O or interruptions. You should look at DPC Time and Interrupt Time and Context Switches. | > 30%(Alert can be generated if it is above this value for two minutes) |
| Processor | Processor Time | CPU Percentage | > 90%(Alert can be generated if it is above this value for two minutes) |
| System | Context Switches/sec | The process of “context switches” is to change the thread that the processor processes. It should not exceed 6000 per CPU. | > 384000 |
| System | Processor Queue Length | Number of processors waiting to run in the processor queue | > 640 |
| PhysicalDisk | Avg. Disk sec/Read | Average read time per second | > 0.30 |
| PhysicalDisk | Avg. Disk sec/Write | Average write time per second | > 0.30 |
| PhysicalDisk | % Idle Time | Percentage of unused disk | < 50%(Alert can be generated if it is above this value for two minutes) |
| SQLServer:Access Methods | Forwarded Records/sec | If the data does not fit on the page during the update, it should be marked with the pointer to another page.
It only happens in the heap tables. Cluster index create-drop can be done.e | >(SQLServer:SQL Statistics:Batch Requests/sec)/10 |
| SQLServer:Access Methods | FreeSpace Scans/sec | This is the process of performing a blank page scan for row to be inserted in the heap tables. | >(SQLServer:SQL Statistics:Batch Requests/sec)/10 |
| SQLServer:Access Methods | Index Searches/sec,Full Scans/sec | Index search and table scan numbers per second. It means you need index. | (Index Searches/sec) / (Full Scans/sec) < 100 |
| SQLServer:Access Methods | Page Splits/sec | The number of pages divided in seconds. Fillfactor will fix the problem. | >(SQLServer:SQL Statistics:Batch Requests/sec)/5 |
| SQLServer:Access Methods | Scan Point Revalidations/sec | The number of scan points re-verified per second during the scan operation to continue | >10 |
| SQLServer:Access Methods | Worktables Created/sec | The number of tables created in tempdb per second (Table spool, Index spool, etc.) | > 400 |
| SQLServer:Buffer Manager | Buffer cache hit ratio | This is the rate at which SQL Server can find the data that it wants from memory. | < 97% |
| SQLServer:Buffer Manager | Lazy writes/sec | The number of dirty pages written to disk per second to free buffer cache. | >20 |
| SQLServer:Buffer Manager | Page life expectancy | The amount of time data pages stay in buffer in seconds. | < 300 |
| SQLServer:Buffer Manager | Page lookups/sec | In seconds, the number of requests sent to find page in buffer pool. If this value is 100 times greater than the number of batch Requests per second, query plans are inefficient. High I/O queries should be tuned. | (Page lookups/sec) / (Batch Requests/sec) > 100 |
| SQLServer:Latches | Latch Waits/sec | The number of waiting latch requests per second | (Total Latch Wait Time) / (Latch Waits/Sec) > 10 |
| SQLServer:Locks | Lock Requests/sec | The number of requests that request lock per second | (Lock Request/sec) / (Batch Requests/sec) > 500 |
| SQLServer:Locks | Lock Timeouts (timeout > 0)/sec | Timeout due to lock | <>0 |
| SQLServer:Locks | Number of Deadlocks/sec | The number of deadlock per second | >0 |
| SQLServer:Memory Manager | Memory Grants Pending | The number of connections waiting for memory | <>0 |
| SQLServer:SQL Statistics | SQL Compilations/sec | The number of queries compiled per second | >(Batch Requests/Sec)/5 |
| SQLServer:SQL Statistics | SQL Re-Compilations/sec | The number of queries recompiled per second. | >(SQL Compilations/sec)/10 |
| SQLServer:Database | Log Flush Waits/sec | Indicates the average wait time of SQL Server when writing to the database’s log.
Increasing values indicate that a long time has elapsed when writing to the log.
This results in concurrency problems and loss of performance in the system. | Increasing values are bad. |
| Network Interface | Bytes Received/sec
Bytes Sent/sec | It shows the amount of data received and sent from the network in bytes per second.
Sudden increases can be the source of the problem if they occur at the same time as performance issues. | Increasing values are bad. |
| SQLServer:Buffer Manager | Checkpoint pages/sec | Indicates the number of times the SQL Server’s checkpoint operation occurred in seconds.
If the Checkpoint process occurs frequently, then there are too many changes. This means more IO. IO can cause a bottleneck.
Sudden increases can be the source of the problem if they occur at the same time as performance issues. | Increasing values are bad. |
![]()