 Database Tutorials MSSQL, Oracle, PostgreSQL, MySQL, MariaDB, DB2, Sybase, Teradata, Big Data, NOSQL, MongoDB, Couchbase, Cassandra, Windows, Linux
With DBCC SHOW_STATISTICS we can get detailed information about a statistic. As many of you know, statistics have one of the most important roles in the decision making of the sql server engine when creating a query plan. The SQL Server Engine looks at the statistics and decides whether or not an index should be used. So first of all, our statistics need to be up to date.
Before you read this article, I recommend that you read the following articles to better understand why you need this command.
“Statistic Concept and Performance Effect on SQL Server“,
“Index Concept and Performance Effect on SQL Server“,
“What is Execution Plan on SQL Server”
DBCC SHOW_STATISTICS shows detailed information about a statistic in a table or indexed view.
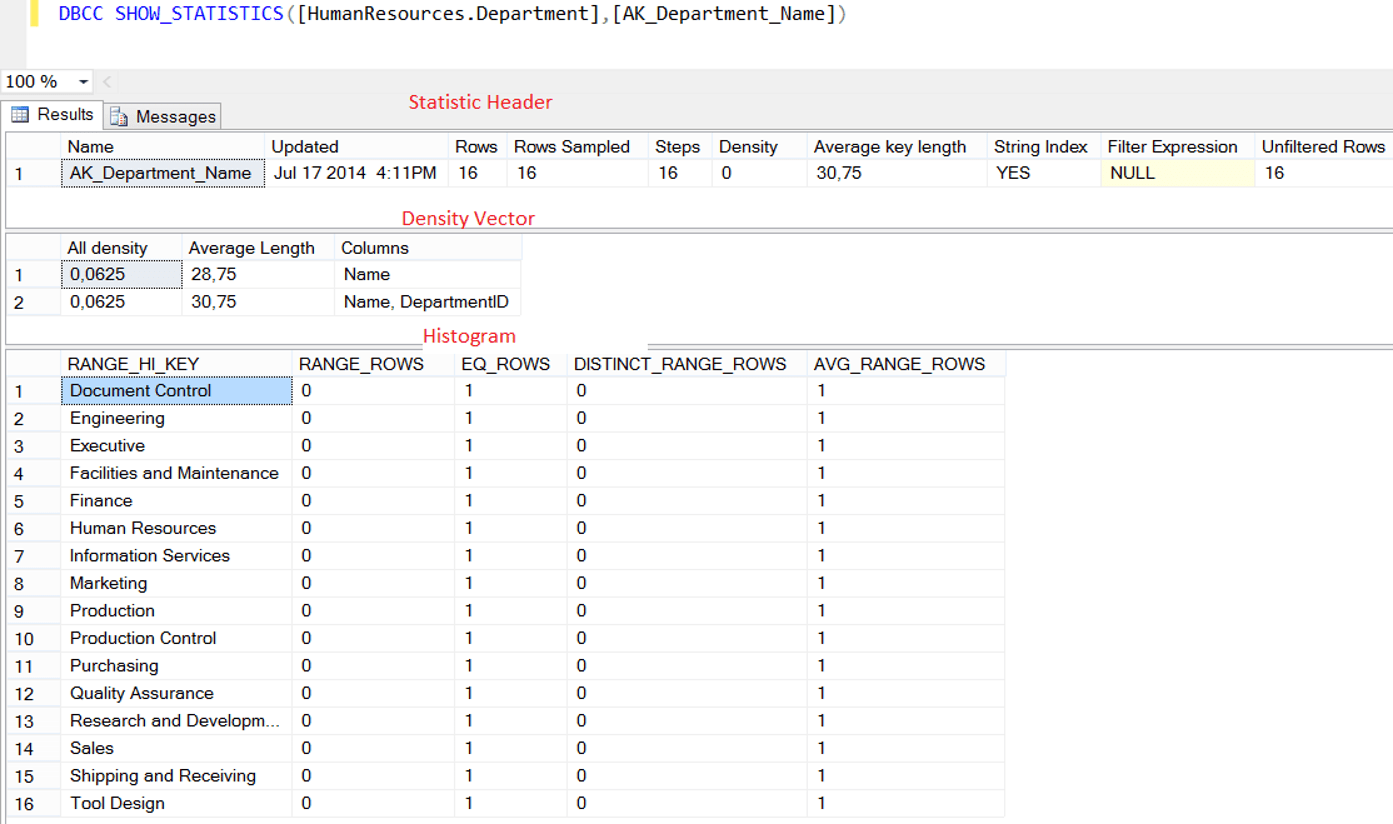
The output of this command consists of 3 elements.
- Statistic Header
- Density Vector
- Histogram
Let us explain the above concepts and details through an example. Run the following command in the AdventureWorks database.
In this command,
HumanReources is the schema name,
Department is the table name and
AK_Department_Name is the statistics name.
1 | DBCC SHOW_STATISTICS([HumanResources.Department],[AK_Department_Name]) |
We see a result set as follows.
In the following tables, you can see the descriptions of the columns in the result set.
| Statistic Header | |
| Name | Statistic Name |
| Updated | Last update date of statistic |
| Rows | Shows the number of rows on the table or indexed view when the statistic were last updated. |
| Rows Sampled | The number of rows sampled when creating or updating statistics. You can find more information in the article “UPDATE STATISTICS in SQL Server” |
| Step | Specifies the number of steps in the histogram. We will mention later. |
| Density | Not used after SQL Server 2008. |
| Average Key Length | The average size of the columns of statistic(in bytes) |
| String Index | If the columns of the statistic are char, varchar, nchar, nvarchar, varchar (max), nvarchar (max), text, or ntext, the value of this column is YES. |
| Filter Expression | If the statistic is filtered, it shows the filter expression. |
| Unfiltered Rows | Shows the number of unfiltered rows. If there is no filter, it will show the number of rows in the corresponding table or indexed view. |
| Density Vector | |
| All Density | This refers to the value “1 / n”. “n” is the number of different records in the table. The closer this row is to 0, the more singularity is achieved. |
| Average Length | The average size of the columns of statistic(in bytes) |
| Columns | This column shows the corresponding columns. |
| Histogram | This is a graph showing the data distribution. When SQL Server generates a statistic, it first sorts the column values. It then divides the data into specific groups and sets the upper limit of each group. For example, consider a column with values from 1 to 1000. In this column, statistics were grouped and divided into 100 group(1 to 10, 10 to 20…990 to 1000). The first group(1 to 10) is defined as step 1. Because of we divide the statistic into 100 group, this means statistic has 100 steps. |
| RANGE_HI_KEY | This is the key value that specifies the upper limit for the Histogram step. So you can think of it as a line separating each step. |
| RANGE ROWS | Estimated number of rows per histogram step |
| EQ_ROWS | Number of records equal to each other at step limit |
| DISTINCT_RANGE_ROWS | Estimated number of non-duplicated rows per histogram step |
| AVG_RANGE_ROWS | Number of duplicated records in the corresponding step |
![]()