 Database Tutorials MSSQL, Oracle, PostgreSQL, MySQL, MariaDB, DB2, Sybase, Teradata, Big Data, NOSQL, MongoDB, Couchbase, Cassandra, Windows, Linux
In my previous articles, we sent the eventlogs on 10.250.2.224(Windows Server) to logstash running on 10.250.2.222 with winlogbeat, we also configured our logstash and transferred the data to elasticsearch and saw the indexes on kibana. In the same way, I later provided the eventlogs on 10.250.2.225 and 226(Windows Server 2019 servers) to be sent to logstash.
In this article, we will create two separate dashoards on kibana, according to Windows event log counts and Windows log on events.
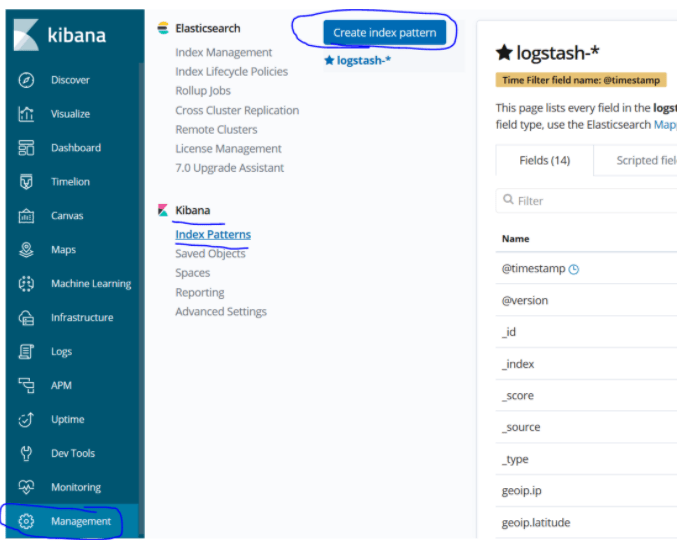
For this, let’s first create a new index pattern. For this, let’s go to Managment> Kibana> Index Pattern> Create index.
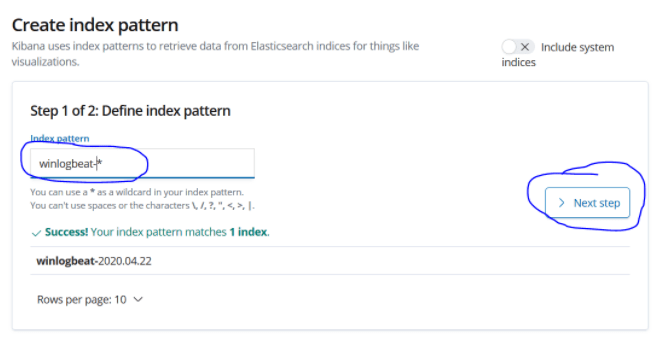
Let’s define our index pattern as winlogbeat- * and proceed with the next step.
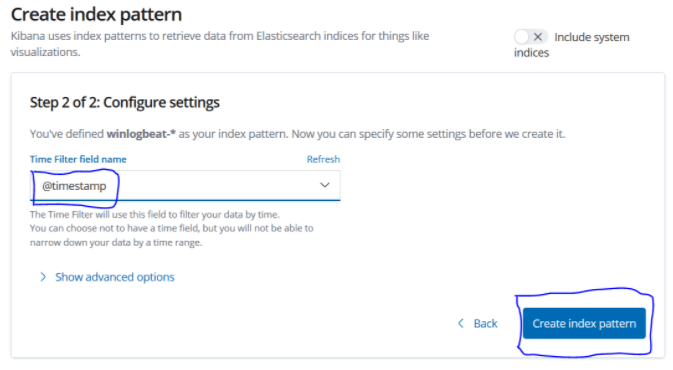
Let’s select the timestamp and create our index pattern with create index pattern.
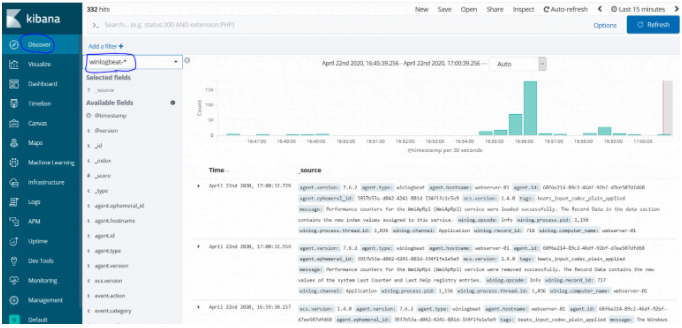
Now we can see the event logs of the servers in discover.
Creating Kibana Dashboard According to Windows Event Count
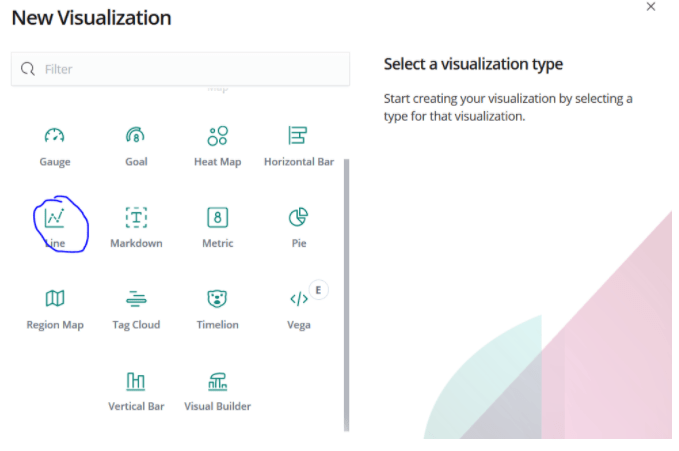
For this, let’s choose Line chart from Visualize> Create New Visualize.
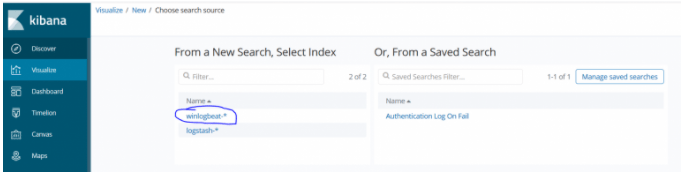
Select the winlogbeat- * index from here.
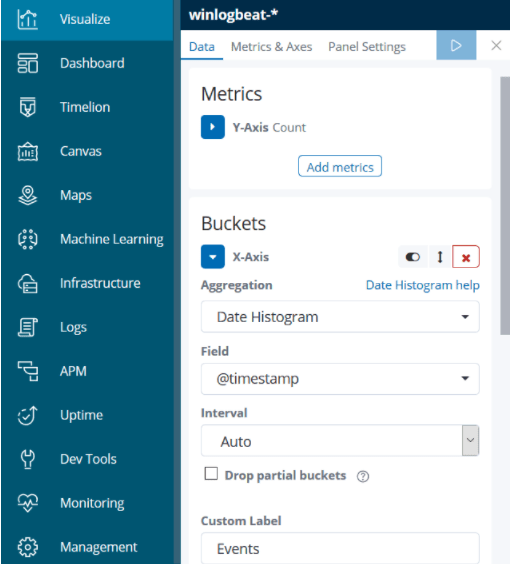
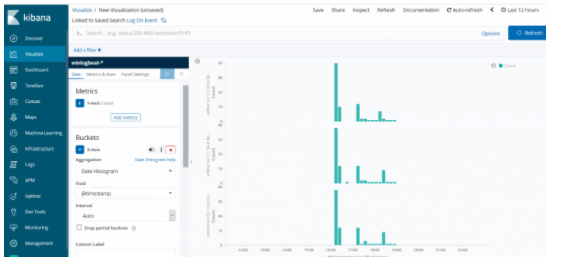
Now we just need to select the areas on the X axis and the Y axis of our line chart. Our Y minus will be Count, and we choose the time on the X axis.
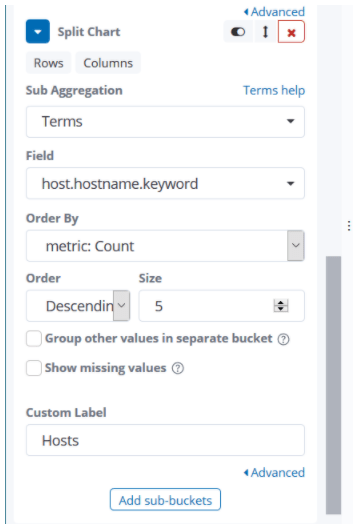
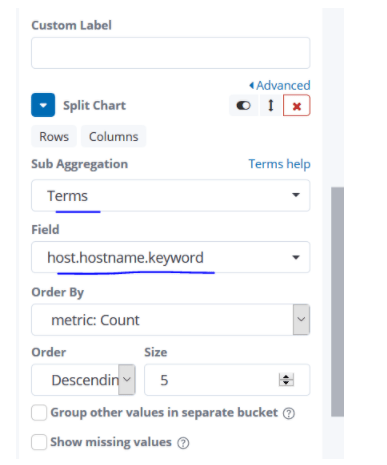
Since I want to show the events that occur per host, I specify that this graph should be edited according to the hostname term from the split chart option.
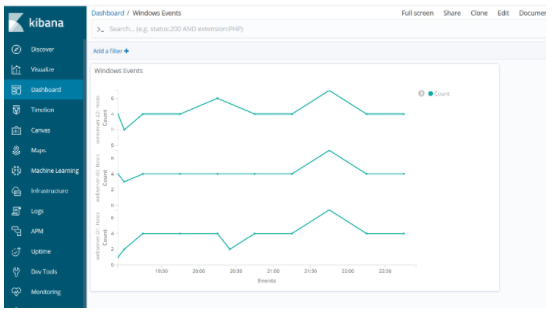
We got a visualize like the one below.
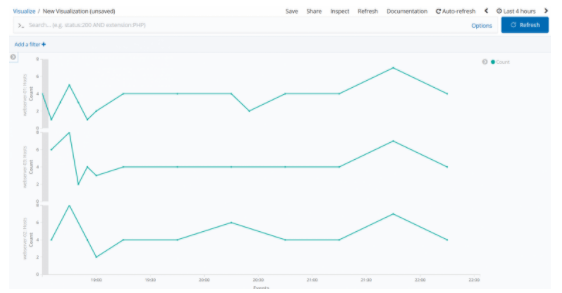
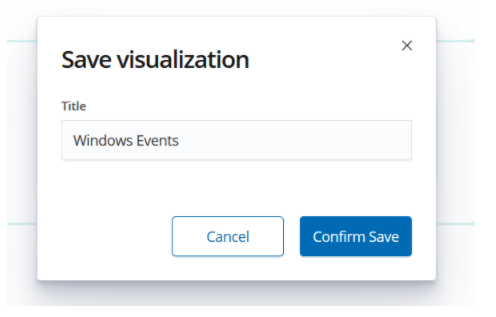
We name and save this visualize to use in the dashboard.
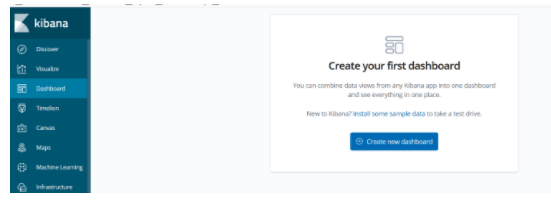
Now all we have to do is simple. We come to the Dashboard section and choose Create new dashboard.
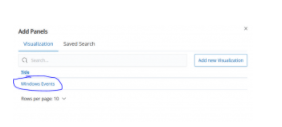
In the Add section, we select Windows Events.
We have now achieved the status we want for the Dashboard, it is enough to save and name this dashdoard we created.
Creating a Dashboard for Log on events in Kibana
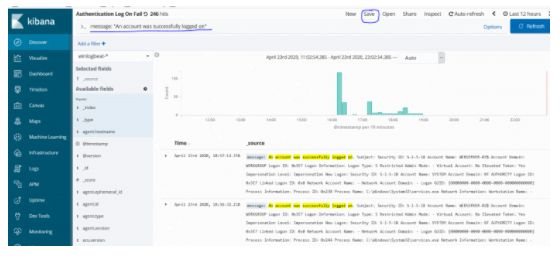
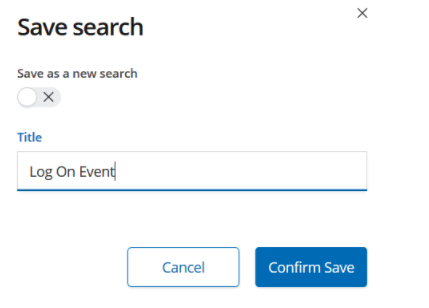
When we come to Kibana discover section, when we make a search like message: “An account was successfully logged on”, we will see “log on” events on the servers. We save this search to visualize it.
Let the name of the search we have recorded be Log On Event.
Click on New Visualize from the Visualize section. We can see the search criteria we have recorded from the Vertical Visualize section. We choose Log On Event.
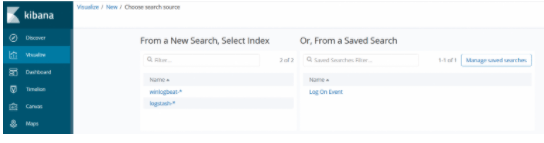
There will be count again in the Y-minus. On the X axis, there will be time. There will be a hostname field in the sub bucket. In this way, we run and save visualize.
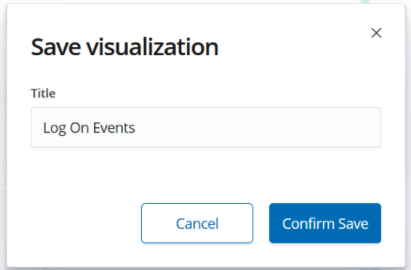
Save Visualize as Log On Events.
By clicking the Dashboard> Create New Dashboard, we select the Log On Events we created and the Windows Events visualizations we created before and save them by naming the dashboard.
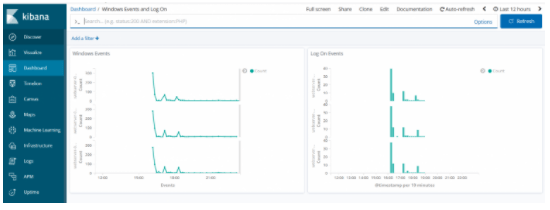
We have successfully created our dashboards according to windows event counts and log on events. Of course, we created these logs by collecting windows event logs using winlogbeat. We also want to get the CPU, RAM and disk usage graphics of the servers. For this, we will need to install metric beat on our servers. In my next article I will be doing this….
You can read our other articles in this serie from the links below.
Install Elasticsearch on ubuntu server 19.10
Install Logstash on Ubuntu Server 19.10
Install Kibana on Ubuntu Server 19.10
Install Winlogbeat on Windows Server 2019
Configure Logstash to Read log files Windows
Create Kibana Dashboards For Windows Event Logs
![]()