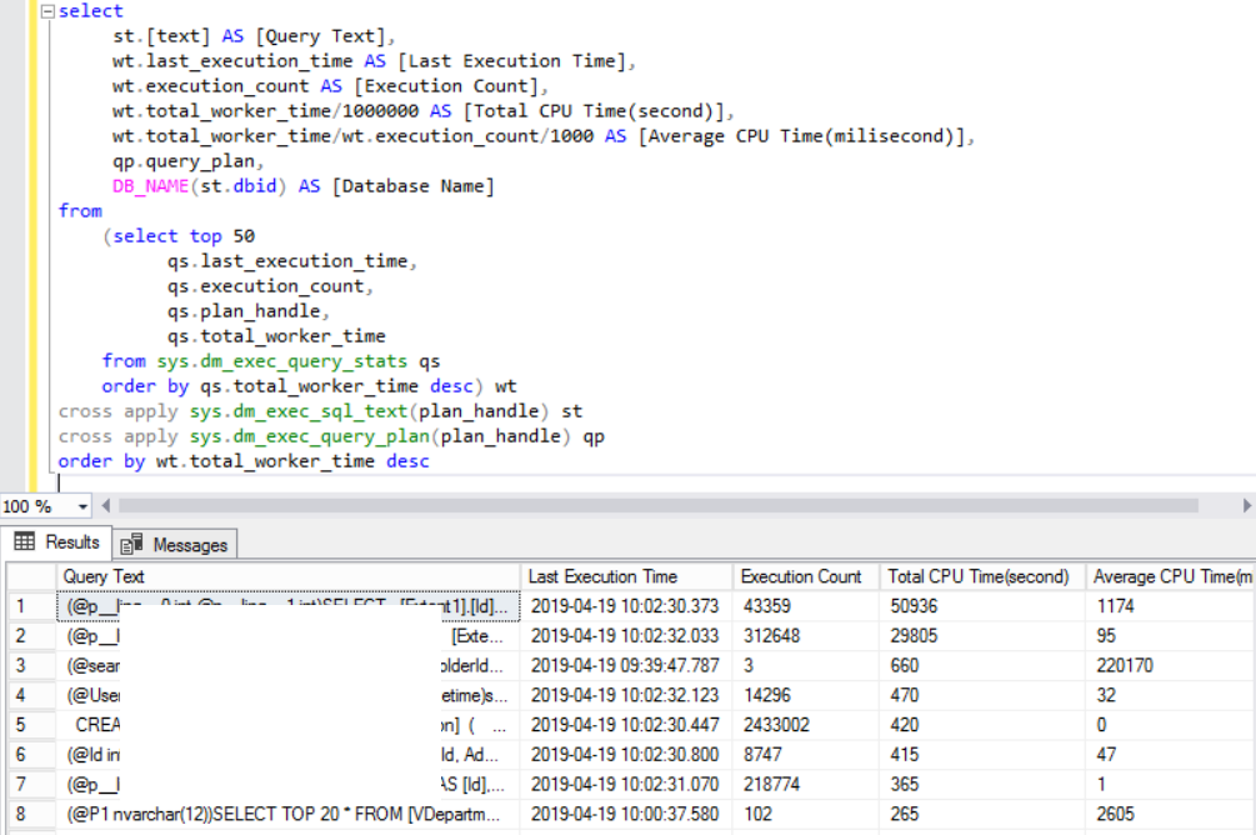
One of the first things that we look at to improve performance in systems that have performance problems is the ones that finding queries that use CPU and Disk most. You can identify the queries that use the CPU most and make the necessary improvements.
Top 50 CPU Consuming Queries in SQL Server
1 2 3 4 5 6 7 8 9 10 11 12 13 14 15 16 17 18 19 | Select st.[text] AS [Query Text], wt.last_execution_time AS [Last Execution Time], wt.execution_count AS [Execution Count], wt.total_worker_time/1000000 AS [Total CPU Time(second)], wt.total_worker_time/wt.execution_count/1000 AS [Average CPU Time(milisecond)], qp.query_plan, DB_NAME(st.dbid) AS [Database Name] from (select top 50 qs.last_execution_time, qs.execution_count, qs.plan_handle, qs.total_worker_time from sys.dm_exec_query_stats qs order by qs.total_worker_time desc) wt cross apply sys.dm_exec_sql_text(plan_handle) st cross apply sys.dm_exec_query_plan(plan_handle) qp order by wt.total_worker_time desc |

All of the values returned as a result of this query are taken from the statistics collected from the moment the sql server service was last started. So if your SQL Server service has been restarted 1 minute ago, you cannot perform a very efficient analysis.
In the query section, shows the parameterized state of the query.
Average CPU Time (in milliseconds) gives the average run time of the query, in milliseconds.
In general, we decide which queries we will improve based on the Average CPU Time (milliseconds). We understand that if the average CPU Time (in milliseconds) of a query that needs to be completed in a few milliseconds is 2 seconds, we need to improve this query.
Sometimes, when we improve a query that has an average CPU Time of 200 milliseconds, we can see that the server’s CPU usage is reduced. In such cases, the query’s Execution Count is usually too much, and if the query’s average CPU Time (milliseconds) is reduced to a few milliseconds, it may have a cumulative impact on the CPU.
Top 50 Disk IO Consuming Queries in SQL Server
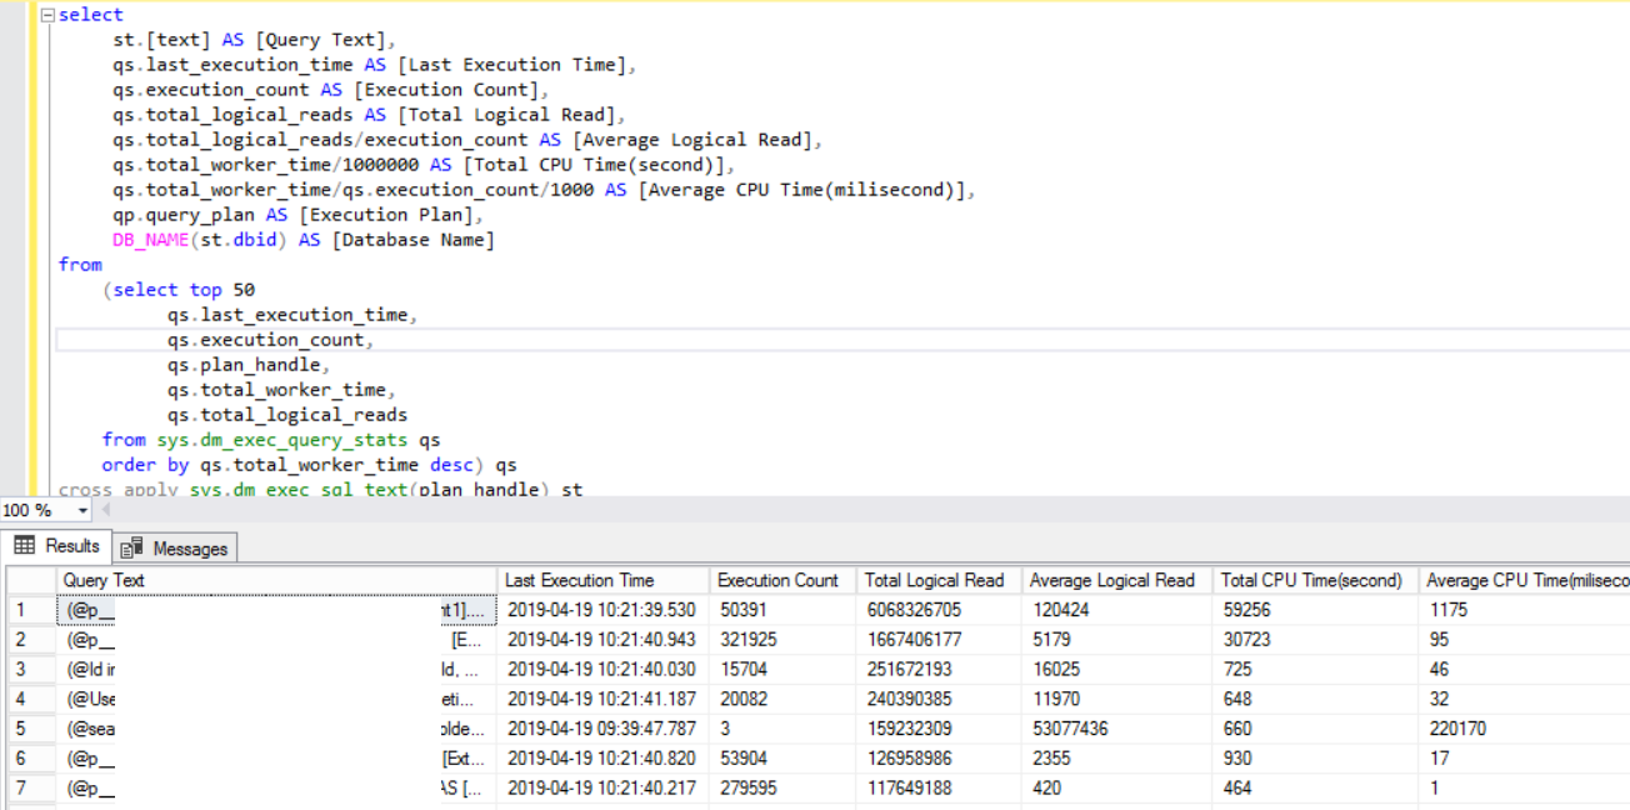
In the following query, you can find it sorted by total logical read. You can sort by another value.
1 2 3 4 5 6 7 8 9 10 11 12 13 14 15 16 17 18 19 20 21 22 | select st.[text] AS [Query Text], qs.last_execution_time AS [Last Execution Time], qs.execution_count AS [Execution Count], qs.total_logical_reads AS [Total Logical Read], qs.total_logical_reads/execution_count AS [Average Logical Read], qs.total_worker_time/1000000 AS [Total CPU Time(second)], qs.total_worker_time/qs.execution_count/1000 AS [Average CPU Time(milisecond)], qp.query_plan AS [Execution Plan], DB_NAME(st.dbid) AS [Database Name] from (select top 50 qs.last_execution_time, qs.execution_count, qs.plan_handle, qs.total_worker_time, qs.total_logical_reads from sys.dm_exec_query_stats qs order by qs.total_worker_time desc) qs cross apply sys.dm_exec_sql_text(plan_handle) st cross apply sys.dm_exec_query_plan(plan_handle) qp order by qs.total_logical_reads desc |

You may want to read the following articles.
“How To Find Missing Indexes in SQL Server”
“How To Identify Long Running Queries Using Extended Events“,
“How To Identify Long Running Queries Using SQL Server Profiler“,
“Running SQL Server With High Performance(High Performance)“,
“Index Concept and Performance Effect on SQL Server“,
“Statistics Concept and Performance Effect on SQL Server”
![]()
 Database Tutorials MSSQL, Oracle, PostgreSQL, MySQL, MariaDB, DB2, Sybase, Teradata, Big Data, NOSQL, MongoDB, Couchbase, Cassandra, Windows, Linux