 Database Tutorials MSSQL, Oracle, PostgreSQL, MySQL, MariaDB, DB2, Sybase, Teradata, Big Data, NOSQL, MongoDB, Couchbase, Cassandra, Windows, Linux
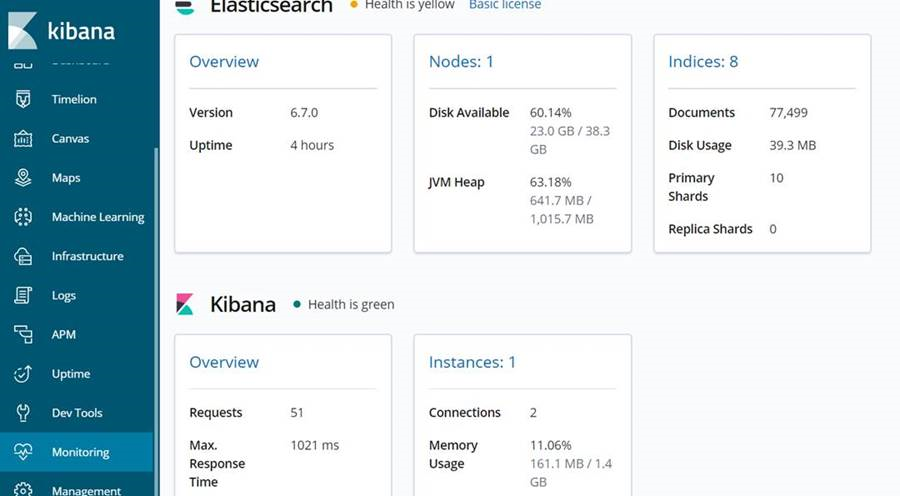
We can monitor Nodes, Indices and Shards in Elasticsearch using Kibana. Connect to Kibana and click Monitoring.
You may want to read the following articles before reading this article.
“How To Install Elasticsearch On Centos“,
“How To Install Kibana On Centos”
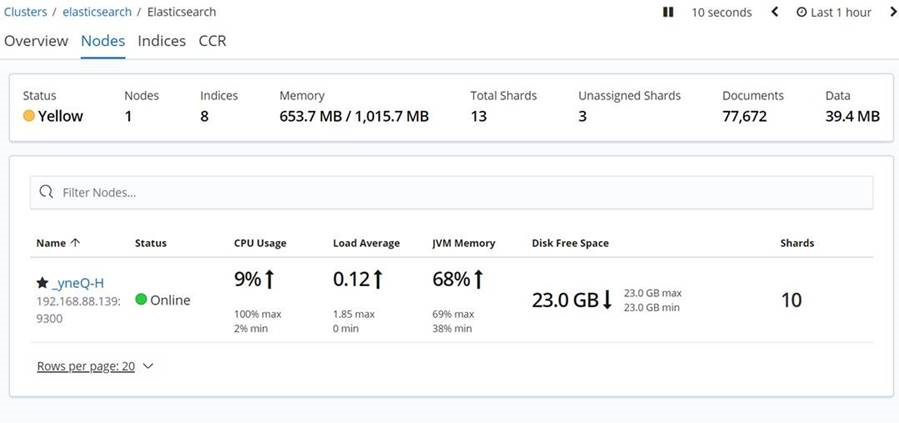
When we click Nodes in the screenshot above, we can see a list of Nodes in elasticsearch. As you can see below, we have a Node named _yneQ-H in our elasticsearch system.
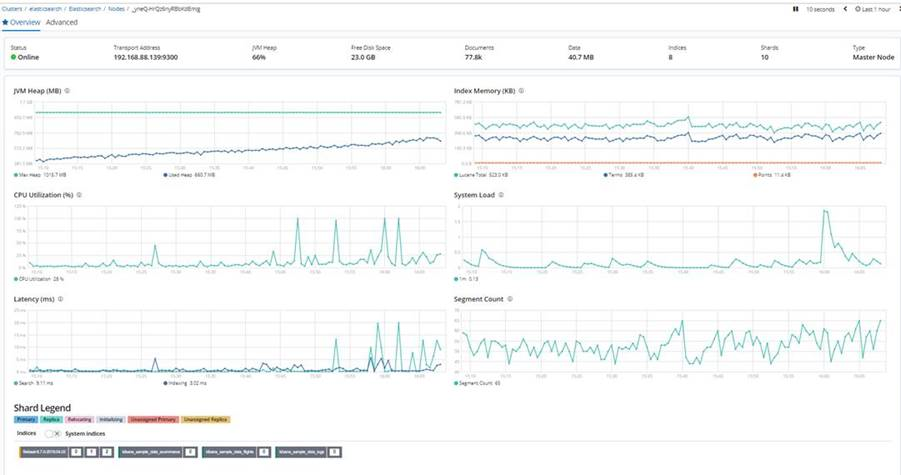
When you click on the name of the Node you can get detailed graphics about Node as below. At the bottom you can see the Shard information on this node.
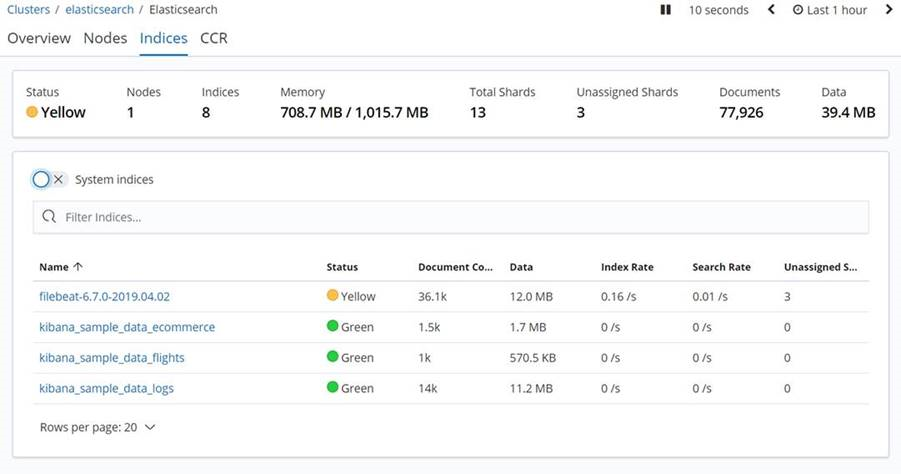
If you click Indices from the first screen, you can access the Indices as you see in the screenshot below. Our indice name is filebeat-6.7.0-2019.04.02.
When you click on the related indice name, you can see detailed information about indice as below. At the bottom, you can see this indice’s shard information.

![]()